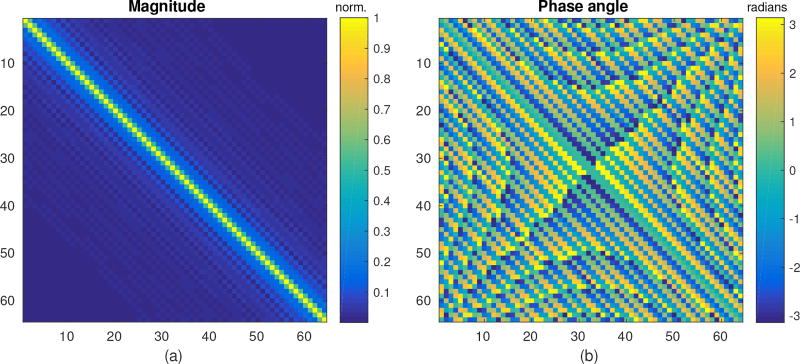
Fig. 2.
(a) Magnitude and (b) phase of HH* at ω = 2πf0 for f0 =3 MHz for a sample phased array scan (described in the text). The plots show magnitude and phase recovery of the transmit elements represented by the main diagonal, with some coherent contribution of neighboring elements. Other elements contribute incoherently and at lower magnitude.

