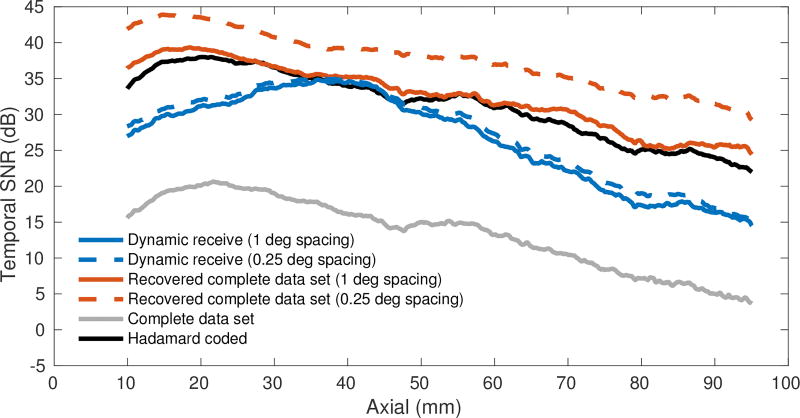
Fig. 9.
Estimated temporal signal-to-noise ratio (SNR) for pairs of data frames after beamforming. Dynamic receive beamforming and recovery of the complete data set were performed on the same focused transmit data set (focus at 40 mm depth) where the solid lines correspond to 1 degree transmit beam sampling (61 transmissions) and dashed lines correspond to 0.25 degree transmit beam sampling (241 transmissions). Estimated SNRs for the complete data set and the Hadamard coded data set are also plotted (each 64 transmissions).

