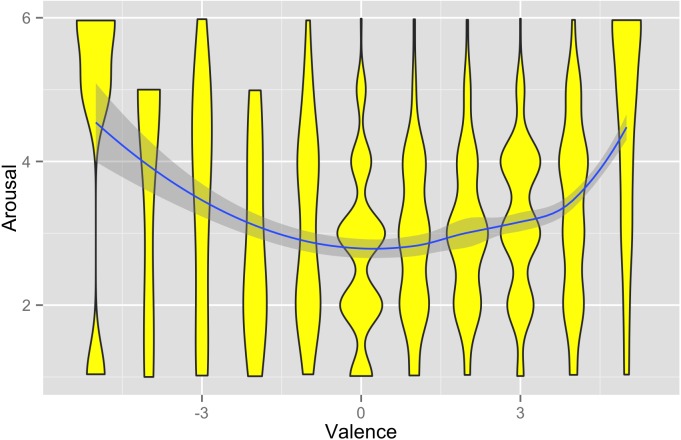
Figure 1. Relationship between affective valence and arousal in the data set.
The polygons show the density of arousal values observed at each value of valence. The solid line and grey shading represent the mean of arousal as a function of valence (and the 95% confidence interval), calculated using locally-weighted polynomial regression.

