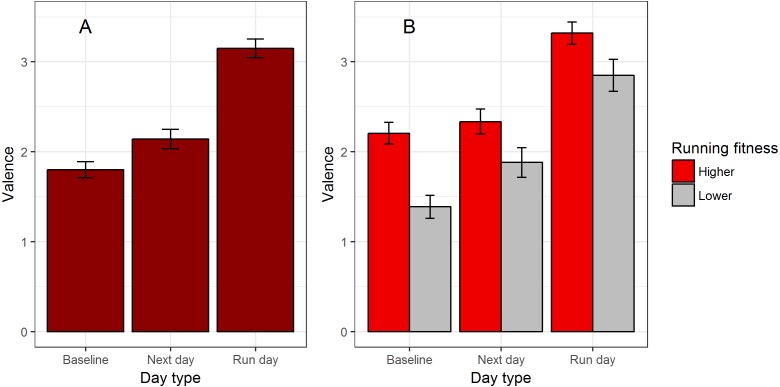
Figure 2. Valence in relation to running.
(A) Mean valence by day type. (B) Mean valence by day type, split by whether the participant’s running fitness (age- and gender-adjusted best 5 k time) is above or below the median for the sample. Error bars represent the standard error of affective reports.

