
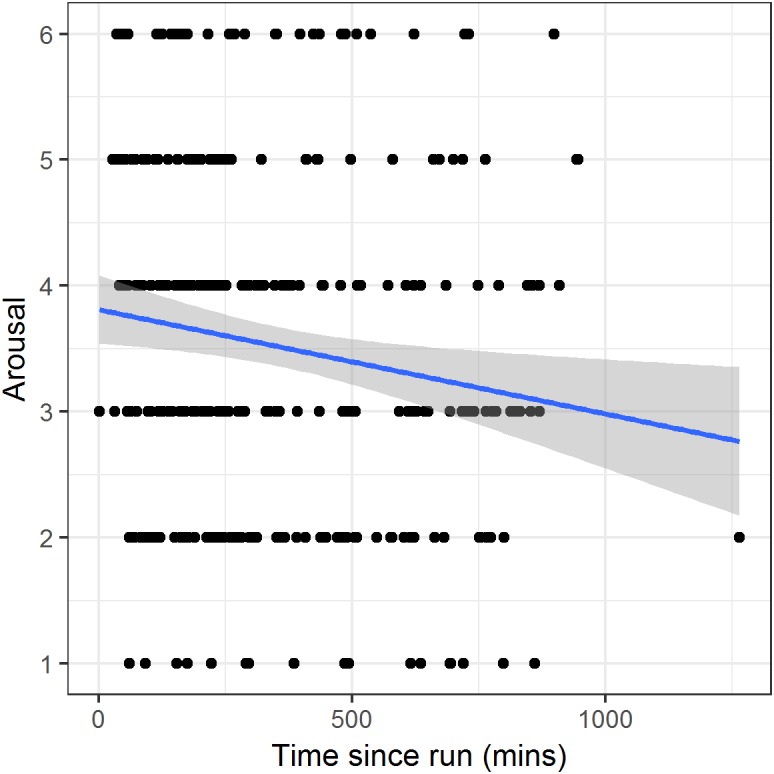
Figure 5. Arousal against time since completion of the run on run days.
Points represent individual reports. The line and shaded region represent a linear fit and its 95% confidence interval.
Official websites use .gov
A
.gov website belongs to an official
government organization in the United States.
Secure .gov websites use HTTPS
A lock (
) or https:// means you've safely
connected to the .gov website. Share sensitive
information only on official, secure websites.
Points represent individual reports. The line and shaded region represent a linear fit and its 95% confidence interval.