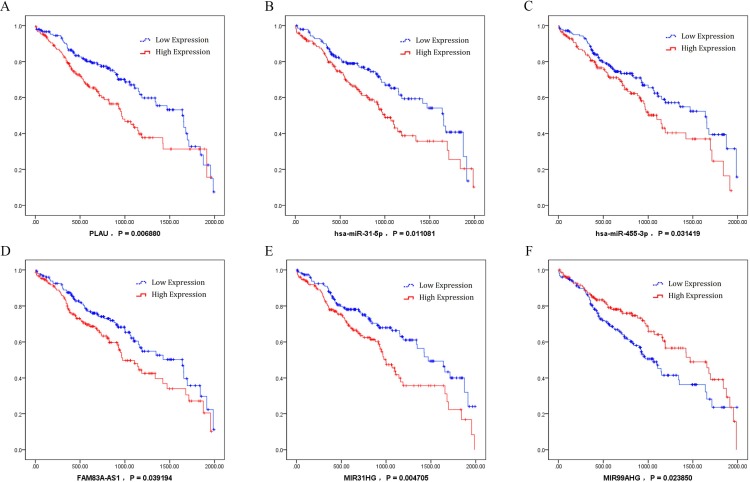
Figure 8. Kaplan–Meier survival curves for six ceRNA (PLAU, miR-31-5p, miR-455-3p, FAM83A-AS1, MIR31HG, and MIR99AHG) associated with overall survival.
Horizontal axis: overall survival time, days; Vertical axis: survival function. (A) PLAU was negatively associated with overall survival; (B) miR-31-5p was negatively associated with overall survival; (C) miR-455-3p was negatively associated with overall survival; (D) FAM83A-AS1 was negatively associated with overall survival; (E) MIR31HG was negatively associated with overall survival; (F) MIR99AHG positively correlated with overall survival.

