Figure 6.
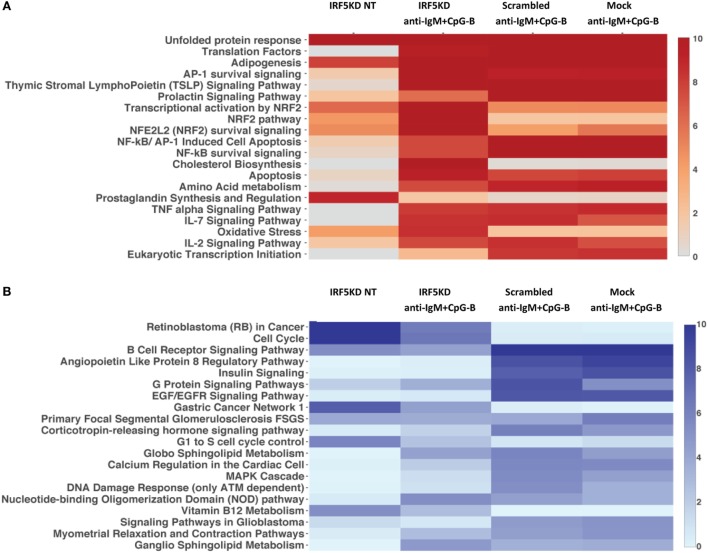
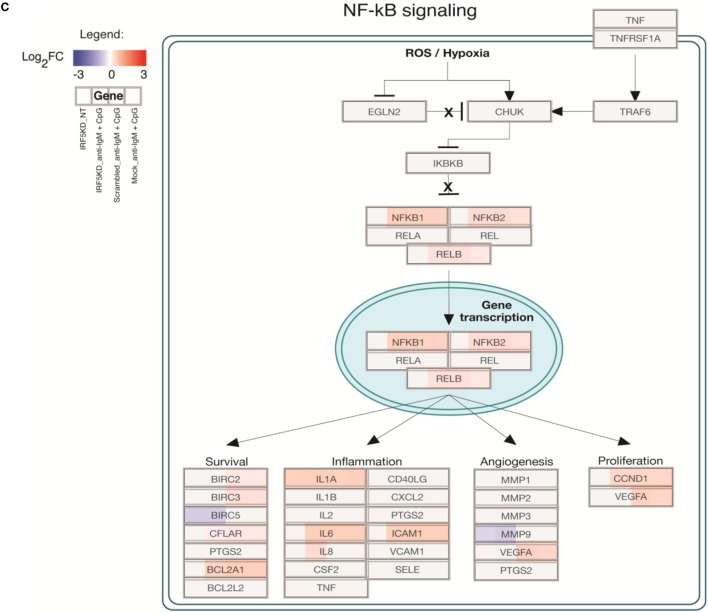
Interferon regulatory factor 5 (IRF5) regulates numerous biologic signaling pathways in human primary B cells. (A) Data from ChIP-Seq and RNA-Seq were used to identify the top 20 upregulated pathways in which there were more upregulated genes than downregulated genes as compared to Mock untreated (NT). Heat map is shown from HOMER analysis with a cutoff of log2FC ≥ 1 representing genes with at least a twofold change in expression and an false discovery rate (FDR) ≤ 0.001. Pathways are ordered by negative log10 p-values of enrichment. (B) Same as (A) except top 20 downregulated pathways are shown. (C) Representative scheme showing enrichment of the upregulated NF-ĸB survival signaling pathway after IRF5 knockdown. Boxes representing genes are color-coded based on the log2 fold-change values. Upregulated (red) or downregulated (blue) genes are shown as compared to Mock NT. Expression is shown by color code in four sections of each gene box. The gene box is divided into sections with one to one mapping comparisons of IRF5KD_NT, IRF5KD_anti-IgM+ CpG, Scr_anti-IgM+ CpG, and Mock_anti-IgM+ CpG vs. reference Mock_NT, as shown in the Legend.


