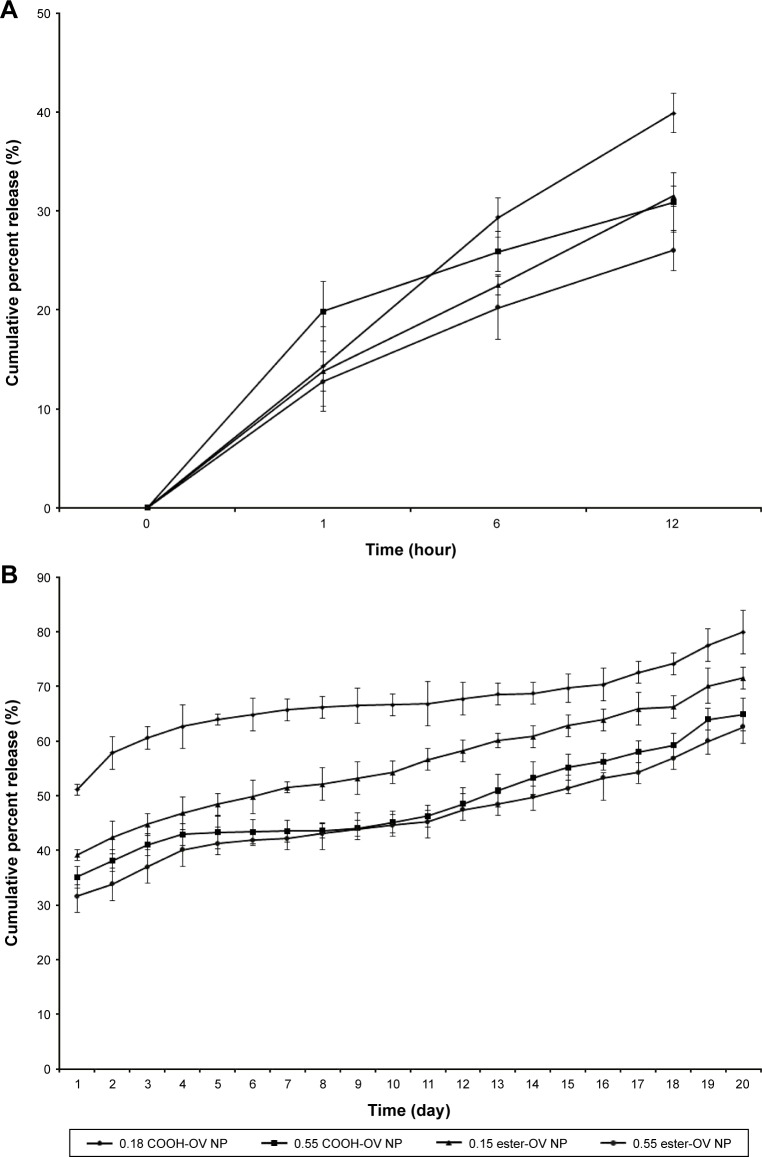
Figure 3.
Cumulative percentage release of OV from different PLGA-graded NPs over a time period of 20 days.
Notes: The line diagram represents the release profile of 0.18 iv COOH-terminated, 0.55 iv COOH-terminated, 0.15 iv ester-terminated, and 0.55 iv ester-terminated PLGA-OV NPs in PBS (pH 7.4) at 37°C. (A, B) Initial burst release and sustained release of OV, respectively. n=3.
Abbreviations: D, day; iv, inherent viscosity; NPs, nanoparticles; OV, ovalbumin; PBS, phosphate-buffered saline; PLGA, poly-lactic-co-glycolide.

