Figure 1.
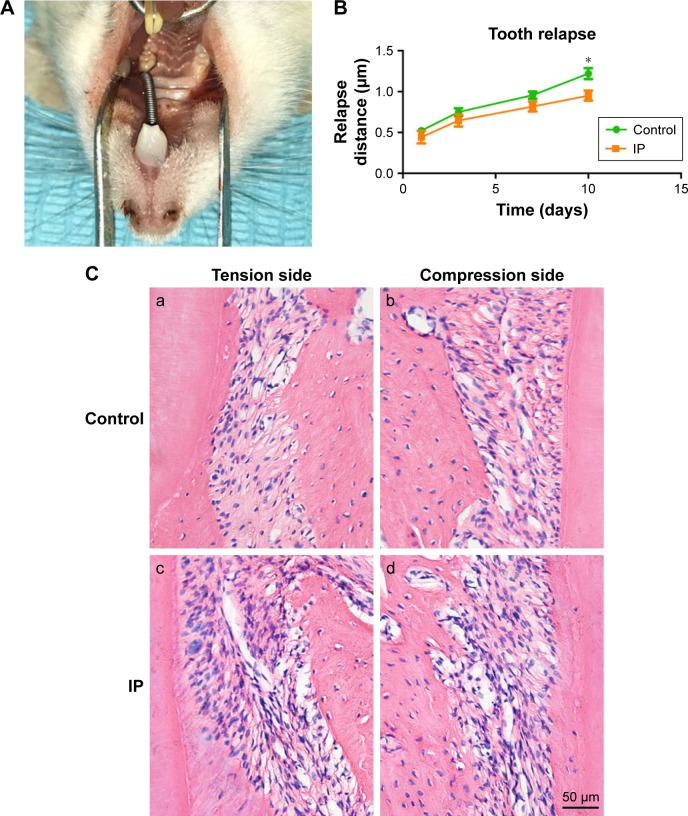
The animal model of relapse following orthodontic tooth movement (A). The relapse distance of control group and IP group (B). Histologic observation of the maxillary first molars on the compression side (b,d) and tension side (a,c). More new bone formation was observed in the IP group (c,d) than the control group (a,b) (hematoxylin and eosin staining, magnification 200×) (C). Bars indicate 50 µm. *P<0.05.
Abbreviation: IP, ipriflavone.

