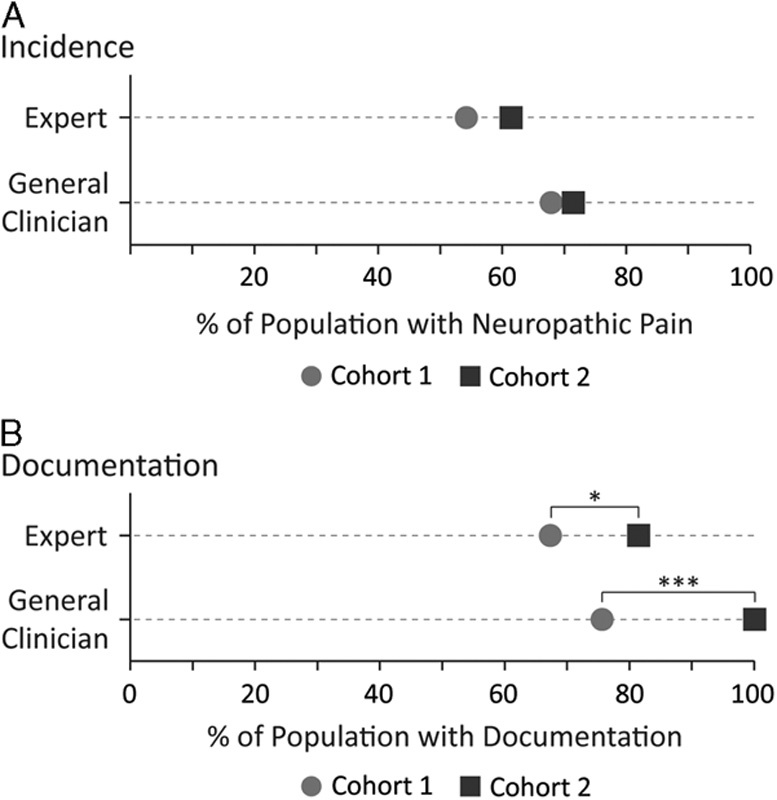
FIGURE 3.

The dot plot comparisons of cohort 1, the control group, and cohort 2, the group with the implemented Vancouver Acute Neuropathic Pain Treatment Guidelines. A) The percent of the participant population diagnosed with neuropathic pain, as reported by the pain expert or the general clinician. B) The percent of the participant population with neuropathic pain documentation, as reported by the pain expert or the general clinician. *P<0.05; ***P<0.001.
