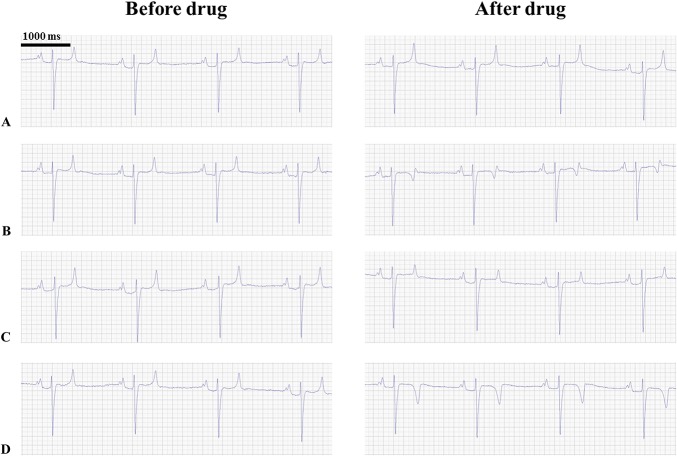
FIGURE 4.
Changes in T-wave morphology following drug treatment. ECGs (lead II) from the same horse before and after administration of drugs: saline (A), dofetilide (B), ranolazine (C), and a combination of dofetilide and ranolazine (D). Note the changes in the T-wave morphology after dofetilide and combination treatment (B, D).

