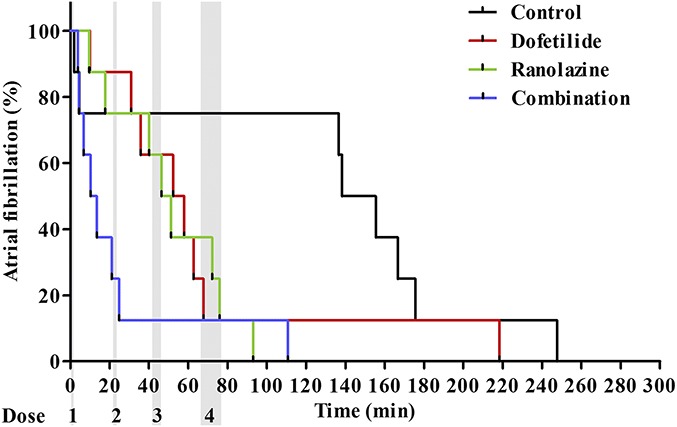
FIGURE 5.

Time from start of drug administration to cardioversion. The percentage of horses remaining in AF as a function of time (in minutes). Time 0 is the start of the first drug administration. The gray areas represent the 4 dose administrations. In all groups n = 8.
