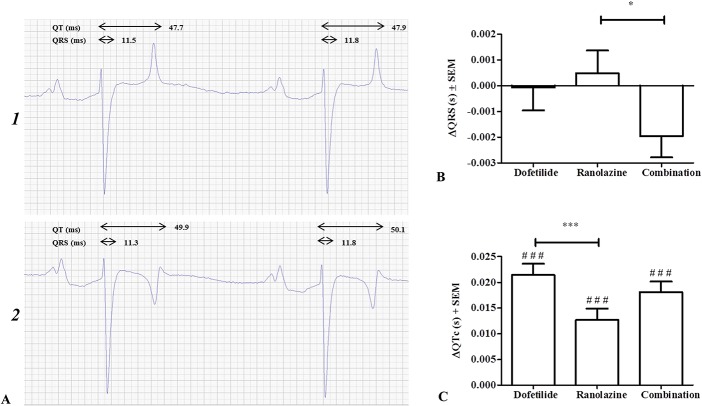
FIGURE 9.
Ventricular effects of drug treatments. A, ECG from the same horse before (1) and after (2) dofetilide administration with illustration of QRS duration and QT interval. Heart rate is 36 bpm in both ECGs. B, QRS duration and (C) corrected QT intervals (QTc) after drug treatment presented as the mean prolongation ± SEM compared with the control group receiving saline. #Represents significance levels of the comparison between the different drug treatments and the control group. *P < 0.05; ***P < 0.001; ###P < 0.001.

