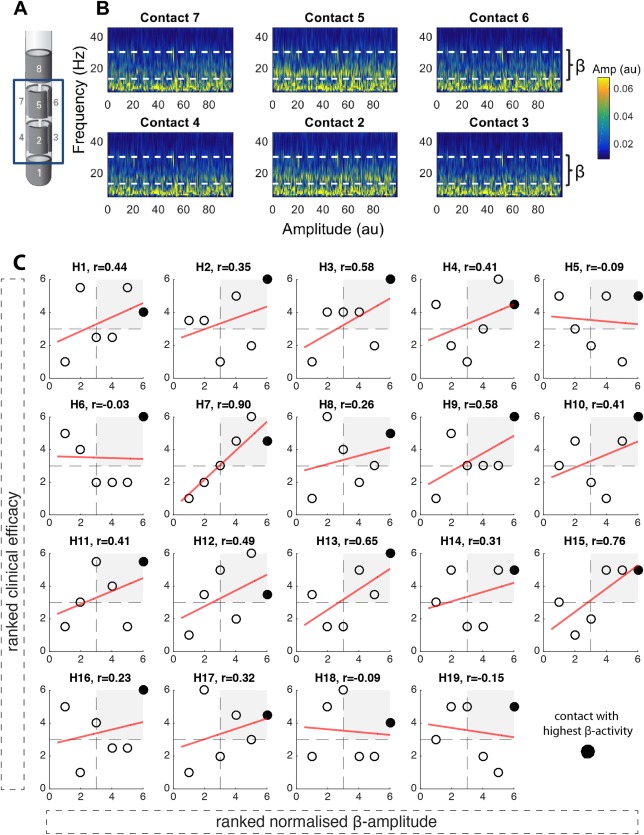
Figure 1.

Directional LFPs and relationship between ranked beta activity and clinical efficacy. (A) illustrates the directional DBS lead (Boston Scientific, Marlborough, MA). Contacts are distributed along four levels. On levels two and three, there are three segmented contacts (level two: contacts 2/3/4; level three: contacts 5/6/7). (B) shows an example time frequency spectrum from an intraoperative LFP recording (duration, 100 seconds) from the six directional contacts (2/3/4; 5/6/7) with the patient awake and at rest. The dashed white line marks the beta frequency band (13‐35 Hz). It shows that LFP beta activity is not equally distributed across directional contacts. Contact 5 shows the highest beta activity, followed by contact 2, with both contacts 5 and 2 oriented in the same direction. Data from the right hemisphere in subject 3 (for raw data, amplitude‐frequency spectrum, and imaging from the same subject and hemisphere, see Supplementary Fig. 1). (C) illustrates the relationships between normalized beta activity and clinical efficacy across the six directional contacts in each hemisphere (H = hemisphere; n = 19). The normalized beta amplitude is shown on the x‐axis, the clinical efficacy on the y‐axis, and Spearman correlation coefficients are shown on the top of each panel. The best electrophysiological contact (contact with highest normalized beta activity) is highlighted in black. The red linear regression fit is shown only for illustration purposes. In 15 hemispheres, a positive relationship between clinical efficacy and normalized beta activity was found (t 18 = 4.65; P < 0.001, one‐sample t test). In 12 of 19 hemispheres, the contact with the highest beta activity matched the clinically most effective stimulation contact. Furthermore, in all hemispheres, the contact with the highest beta activity was localized in the upper‐right quadrant, where the clinically more efficient contacts are localized. Clinical efficacy and normalized beta activity are illustrated as ranked values; Supplementary Figure 3 shows the same figure with nonranked values. [Color figure can be viewed at wileyonlinelibrary.com]
