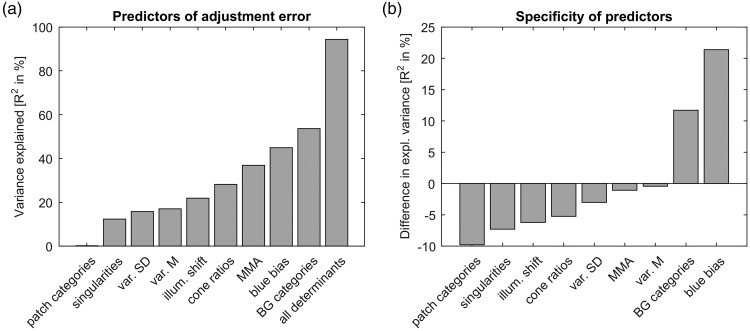
Figure 6.
Contribution of each determinant. (a) Variance of adjustment errors explained by each determinant. The x-axis lists different determinants ordered by the variance they explain. The y-axis represents the variance in percent explained by these determinants. All determinants and the adjustment error were computed in CIELAB. The first seven bars correspond to the correlations of the adjustment errors with naming consistencies for the induced colour on the patch (categories: patch), sensory singularities (singularities), average and standard deviation of colour variegation of distractors (var. M and var. SD), metamer mismatch areas (MMA), cone ratios, illumination shift (illum. shift), the distance of the illumination hue to daylight blue (blue bias), and the naming consistency for illumination in the background of the stimulus display (categories: BG). The right-most bar illustrates the variance explained by a multiple regression with all determinants together as predictors. (b) Difference between average explained variance of adjustment errors of all multiple regressions with and without each predictor. The difference of average R2 in percent is shown along the y-axis. Otherwise, the format is the same as in Panel a.

