Fig 3.
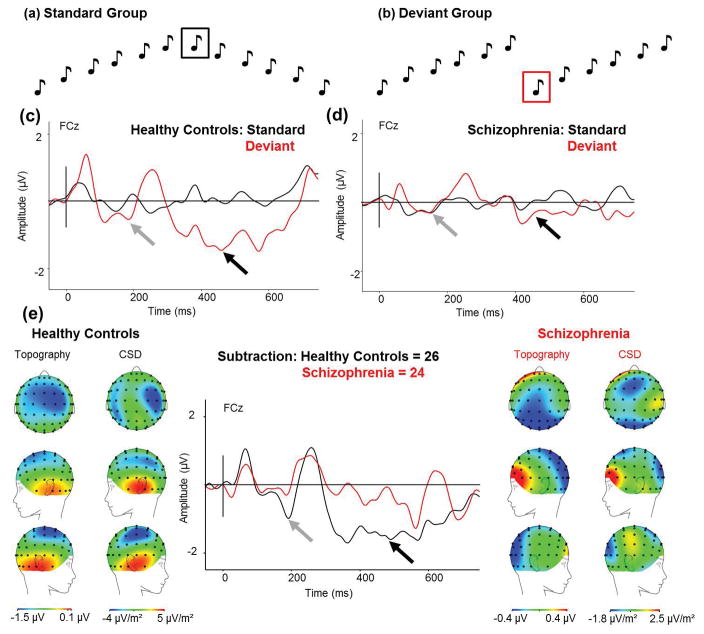
(a) Standard groups of six tones ascending in pitch followed by six tone descending in pitch (the waveform to the black boxed tone is used as the standard response in the analysis), and (b) deviant groups of tones with the six ascending tones repeating twice (the waveform to the red boxed tone is used as the deviant response in the analysis). (c) ERP waveforms in HC in response to the scales-pitch-deviant (red) and the standard tone (black) for FCz electrode site. (d) ERP waveforms in Sz in response to the scales-pitchdeviant (red) and the standard tone (black) for FCz electrode. (e) The MMN response (standard waveform subtracted from the deviant waveform) to the scales-pitch-deviant in HC and Sz from the onset of the deviant to show maximal MMN amplitude. (From Left to Right) Scalp topography and current source density (CSD) maps of the MMN to the scales-pitch-deviant in HC; simple MMN waveform to the scales-pitch-deviant in HC (black) and Sz (red) as indicated by the arrow for FCz electrode; scalp topography and CSD maps to the scales-pitch-deviant in Sz. Scales of topography and CSD maps were adjusted to accurately reflect distribution in each group unconfounded by the main effect. Zero denotes the onset of seventh tone in the group. Early MMN indicated by grey arrow, mid MMN indicated by mid-grey arrow, and late MMN indicated by black arrow.

