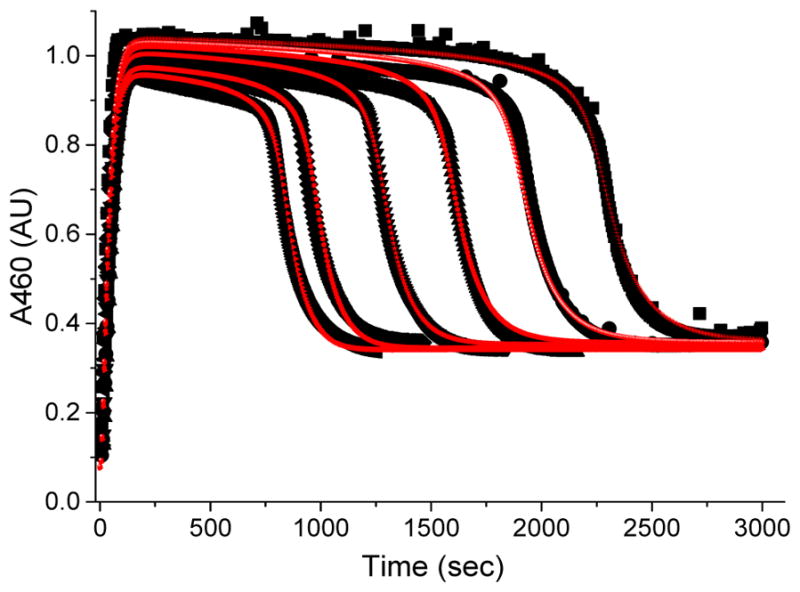
Figure 11.

Black traces represent kinetic time courses of 3a* (460 nm) generated by adding 20 equiv. of H2O2 (90 % v/v) to a 0.5 mM solution of 1a* in CH3CN −40 °C in the presence of 200 equiv. of AcOH and various equivalents of 1-octene. The red traces indicate fits derived from numerical simulation of the experimental data according to the model presented in Scheme 2. The traces from right to left correspond to 0, 50, 100, 200, 400 and 600 equiv. of 1-octene added.
