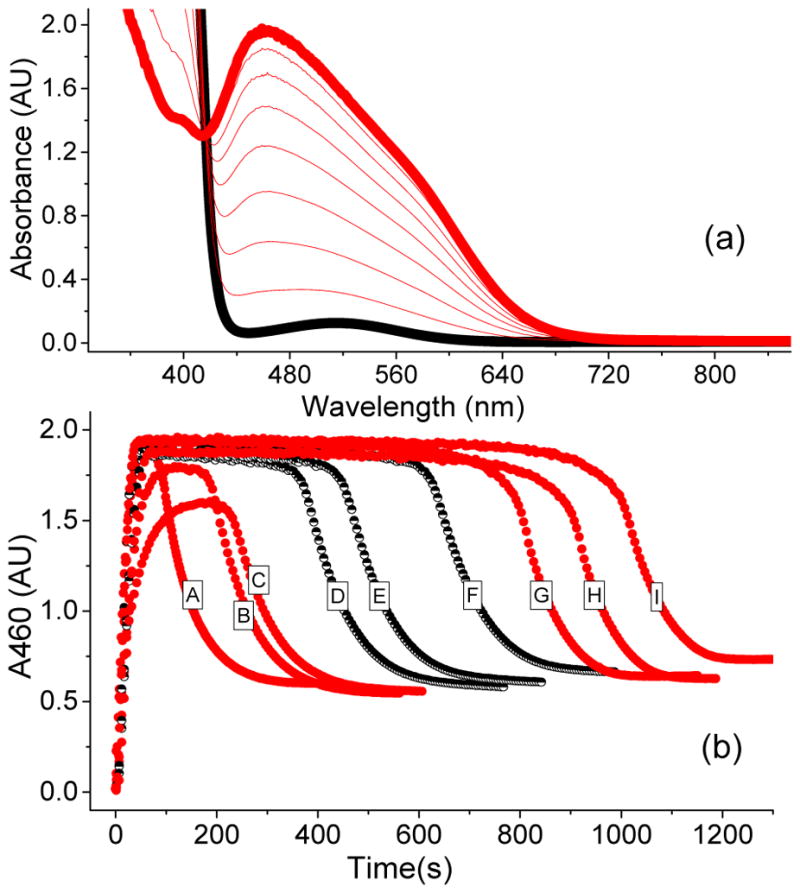
Figure 2.

(a) UV-vis spectrum of a catalytic oxidation reaction involving 1a* (1 mM), H2O2 (10 mM), and AcOH (200 mM) in CH3CN at −40 °C showing the formation of 3a*, which is generated in 50 % yield relative to the 1a*. (b) The time traces depict the kinetic time course of 3a* as monitored at 460 nm in the presence of various substrate types and concentrations. A = 250 mM cyclohexadiene; B = 250 mM cyclohexene; C = 250 mM cyclooctene; D = 250 mM 1-octene; E = 125 mM 1-octene; F = 62.5 mM 1-octene; G = 250 mM cyclohexane; H = 250 mM tert-butyl acrylate; I = No substrate. The black half-filled circles representing different 1-octene concentrations demonstrate that the length of the steady state phase is also influenced by this variable.
