Figure 3.

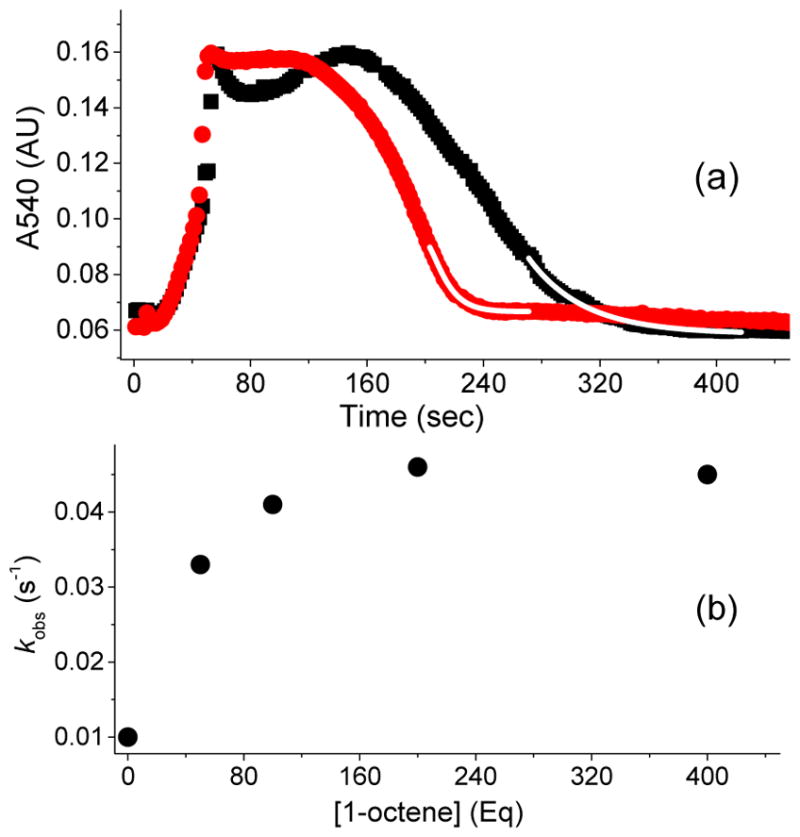
(a) Kinetic time course of 3a (monitored at 540 nm), generated in 20 % yield by adding 20 equiv. of H2O2 (90 % v/v) to a 0.5 mM solution of 1a in CH3CN at −40 °C in the presence of 200 equiv. of AcOH with either no substrate added (black rectangles) or with 50 equiv. 1-octene (red circles). Addition of 1-octene increases the decay rate constant of 3a by a factor of 5. The fitting to obtain the decay rate constant was conducted during the last turnover (upon depletion of HOOH). The decay time course is exponential as the reaction nears completion. The starting points for the exponential fits shown (white line) are chosen well after the transition from the steady state portion of the time course. (b) Correlation between the observed decay rate constants for 3a and 1-octene concentration in the catalytic oxidation of 1-octene using 1a (0.5 mM), H2O2 (10 mM), and AcOH (100 mM) in CH3CN at −40 °C. Note that the kinetic evolution of 3a was monitored at 540 nm, because the 460 nm λmax has significant background contribution from the decay product due to the low yield of 3a. For comparison, the kinetic behavior of 3a* is identical whether followed at its λmax of 460 nm or at 540 nm (Figure S1).
