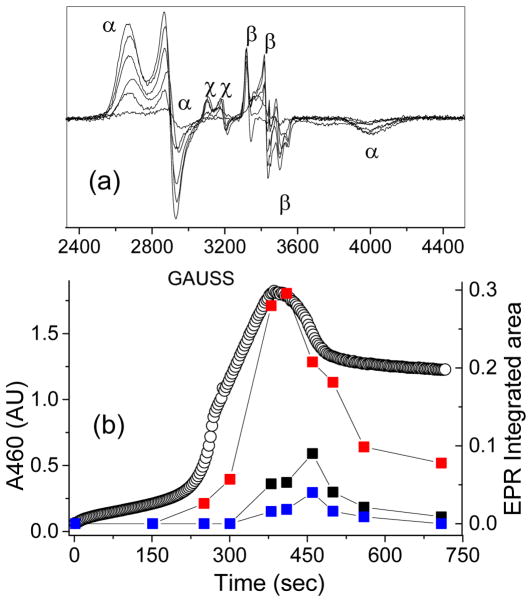
Figure 6.
(a) EPR spectrum of a frozen mixture of 1a* and AcOOH in CH3CN showing the formation and decay of 3a* at g = 2.58, 2.38, 1.73 (α, 28 %), 5a* at g = 2.07, 2.01, 1.96 (β, 9 %), and 6a* at g = 2.21, 2.16, 1.94 (χ, 4 %) as a function of time. (b) EPR time-trace for 3a* (red boxes), 5a* (black boxes) and 6a* (blue boxes). The black, open circles represent the optical chromophore of 3a*, monitored at the 460 nm wavelength. EPR conditions: T = 20K, 0.2 mW, 1 mT modulation amplitude.

