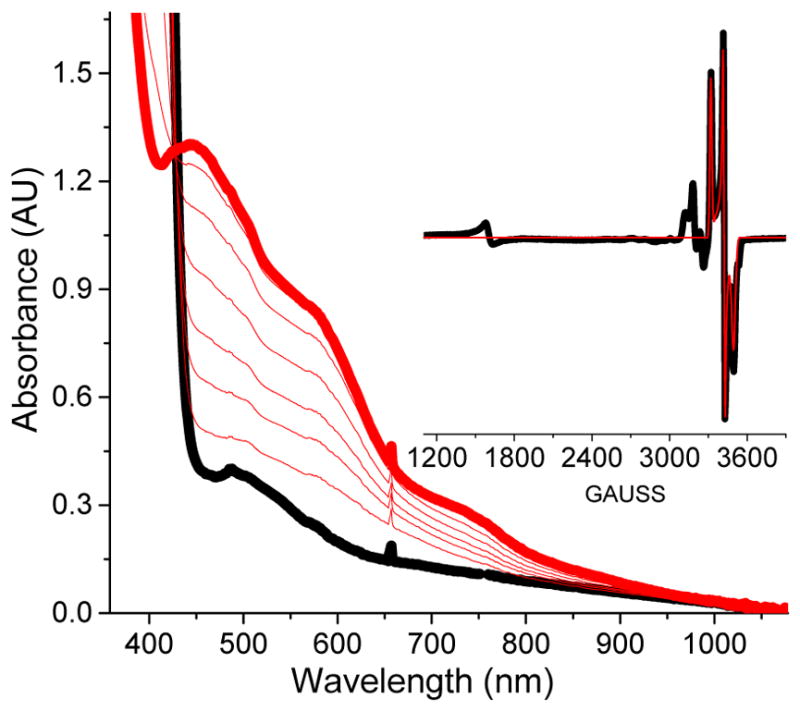
Figure 7.

UV-vis spectral evolution of a reaction of 1.5 mM 1a with 5 equiv. of cyclohexane peroxycarboxylic acid (CPCA) in CH3CN/(CH3)2CO (1:1 v/v) at −65 °C. (Inset) EPR spectrum of a sample frozen upon maximum accumulation of the chromophoric species. The black trace is the experimental spectrum, while the red trace is the S = ½ SpinCount simulation with g = 2.07, 2.01, and 1.96 (10 % of total Fe). EPR conditions: T = 20 K, 0.2 mW power, 1 mT modulation.
