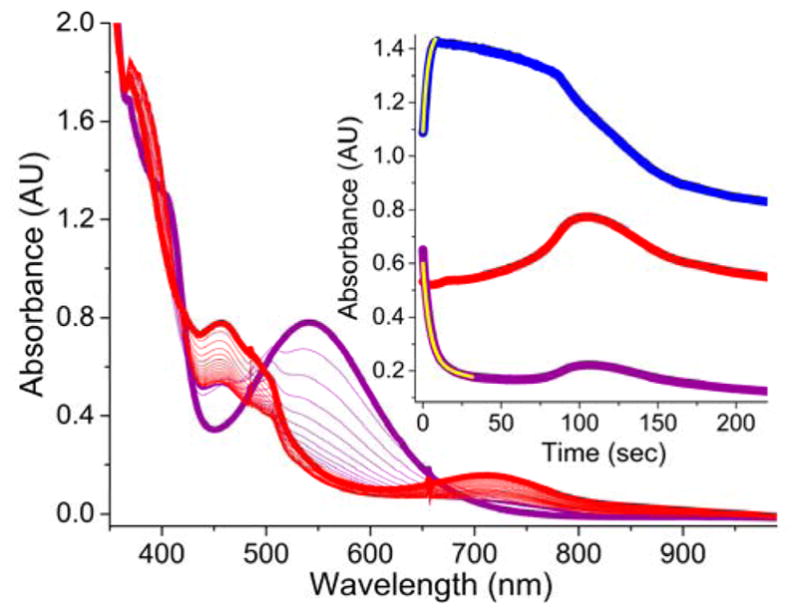
Figure 9.

The addition of AcOH (200 equiv.) to 2a (CH3CN, purple trace) generated from a 1 mM CH3CN solution of 1a and H2O2 (10 equiv.) at −40 °C, initiates the decay of 2a (purple trace) and the subsequent formation of 3a (red trace). (Inset) Time trace for the same reaction monitored at 460 nm (red trace), 540 nm (purple trace) and 370 nm (blue trace) wavelengths. The yellow traces in the inset are single exponential fits for the decay of 2a (kobs = 0.17(1) s−1) and formation of 4a (kobs = 0.19(1) s−1). While the decay of 2a is complete within 50 seconds (purple trace), the maximal accumulation of 3a is not complete until 120 seconds (red trace). 3a also possesses an electronic absorption band at 540 nm accounting for the increase in absorption at 540 nm concomitant with the increase at its λmax of 460 nm.
