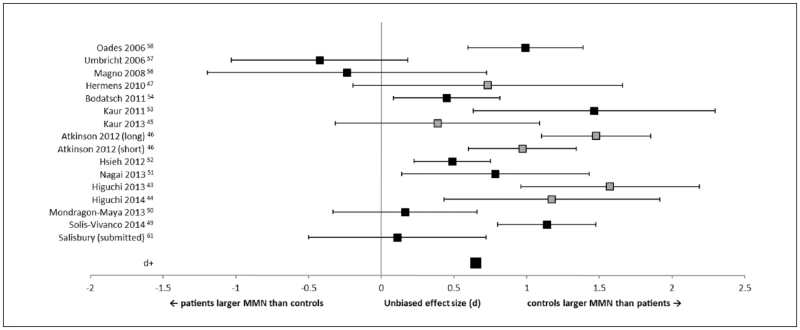
Figure 3.
Forest plot of effect sizes for studies measuring mismatch negativity (MMN) to duration-deviants, including studies with mixed schizophrenia spectrum and affective psychosis diagnoses. Error bars are 95% confidence intervals. The average effect size (d+) is at the bottom of the graph. Gray squares are the studies that contained mixed diagnosis samples.

