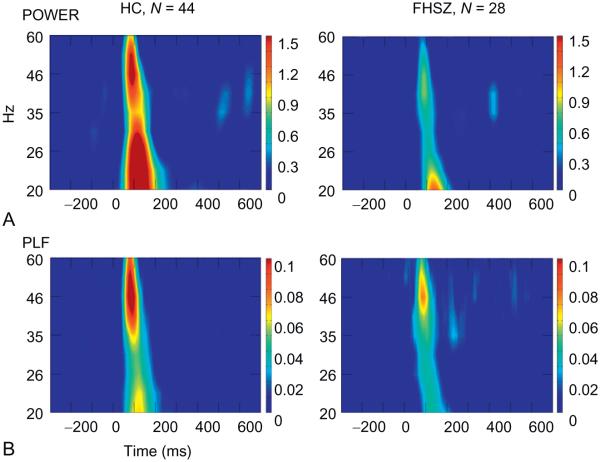
Fig. 2.
(A) Frequency in time maps of evoked power at Cz for each group for standard stimuli. Note that patients show attenuated evoked power in that time interval relative to controls. The lower (f) activity reflects N1 and P2. (B) Phase-locking factor at Cz for each group for standard stimuli. Although maximum evoked power was observed at 46 Hz in controls, their maximum PLF was lower, closer to 40 Hz. Patients showed very little phase consistency across trials.

