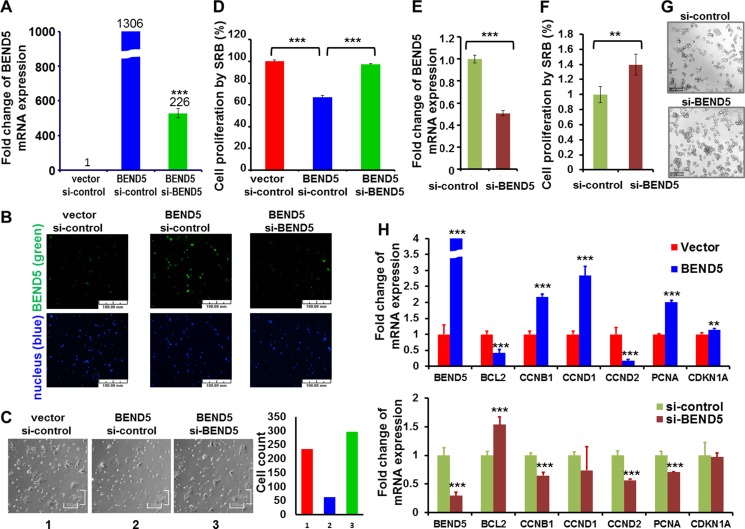
Figure 5. BEND5 may repress cell growth in colon cancer cell.
(A) Plasmid of BEND5 and/or si-BEND5 was transfected to DLD-1 cells for 24 h and then analyzed through real-time RT-PCR and immunofluorescence staining for mRNA and (B) protein expression, respectively. Scale bars represent 100 µm. (C) The bright view was taken for cell morphology. Scale bars represent 100 µm. (D) Cells were analyzed using the SRB assay for cell growth. (E) Knockdown of BEND5 was performed in COLO 320DM colon cells. Real-time PCR was performed at 48 h; (F) Cells were analyzed using the SRB assay for cell growth at 48 h; (G) The bright view was taken for evaluating cell morphology. Scale bars represent 157.5 µm. (H) Real-time RT-PCR was performed to analyze the expression of CCNB1, PCNA, CCND1, and BCL2 after BEND5 overexpression in DLD-1 colon cancer cells or BEND5 knockdown in COLO 320 DM colon cancer cells. The data are presented as means ± SD, **P ≤ 0.01, ***P ≤ 0.001. The t test was used to calculate the group differences in all the experiments. The experiments were performed with at least two biological duplicates and three technical replicates. Panels B and C were not taken in the same fields.

