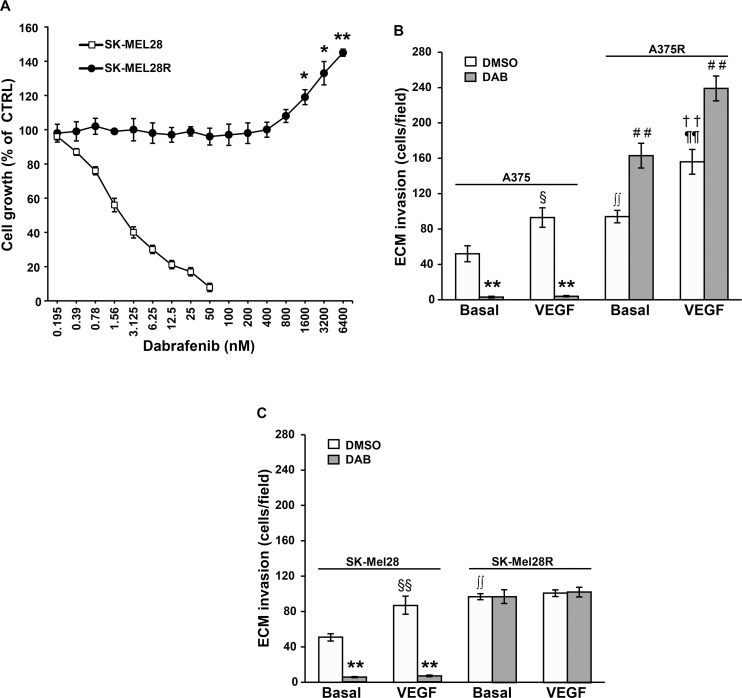
Figure 1. Characterization of the dabrafenib-resistant SK-Mel28R cells.
(A) SK-Mel28 and SK-Mel28R cells were incubated with graded concentrations of dabrafenib or with DMSO alone for five days and then proliferation was assessed by the MTT assay. Data are expressed in terms of percentage of growth of cells treated with dabrafenib with respect to cells treated with DMSO alone (CTRL). Each value represents the arithmetic mean of four (SK-Mel28) or three (SK-Mel28R) independent experiments. Bars, standard error of the mean (SEM). For each experiment, the dabrafenib IC50 value was calculated as described in the “Materials and methods” section. The IC50 mean value ± SEM was 3.05 ± 0.39 nM for SK-Mel28 cells and not assessable for SK-Mel28R cells. **P < 0.01 and *P < 0.05 comparing dabrafenib-treated with DMSO-treated SK-Mel28R cells. (B) A375 and A375R cells were cultured in the presence of 100 nM dabrafenib (DAB) or DMSO alone for 48 h. Thereafter, cell ability to invade the ECM, either spontaneously (Basal) or in response to VEGF-A was evaluated. Data are expressed as number of invaded cells per microscopic field. Each value represents the arithmetic mean ± SEM of four independent experiments. §P < 0.05 A375/VEGF-A versus (vs) A375/Basal; **P < 0.01 A375/DAB vs A375/DMSO; ††P < 0.01 A375R/VEGF-A vs A375R/Basal; ##P < 0.01 A375R/DAB vs A375R/DMSO; ∫∫P < 0.01 A375R/basal vs A375/basal; ¶¶P < 0.01 A375R/VEGF-A vs A375/VEGF-A. (C) SK-Mel28 and SK-Mel28R were treated and analyzed for ECM invasion as described in (B). Data are expressed as number of invaded cells per microscopic field. Each value represents the arithmetic mean ± SEM of six (SK-Mel28) or four (SK-Mel28R) independent experiments. §§P < 0.01 SK-Mel28/VEGF-A vs SK-Mel28/Basal; **P < 0.01 SK-Mel28/DAB vs SK-Mel28/DMSO; ∫∫P < 0.01 SK-Mel28R/basal vs SK-Mel28/basal.

