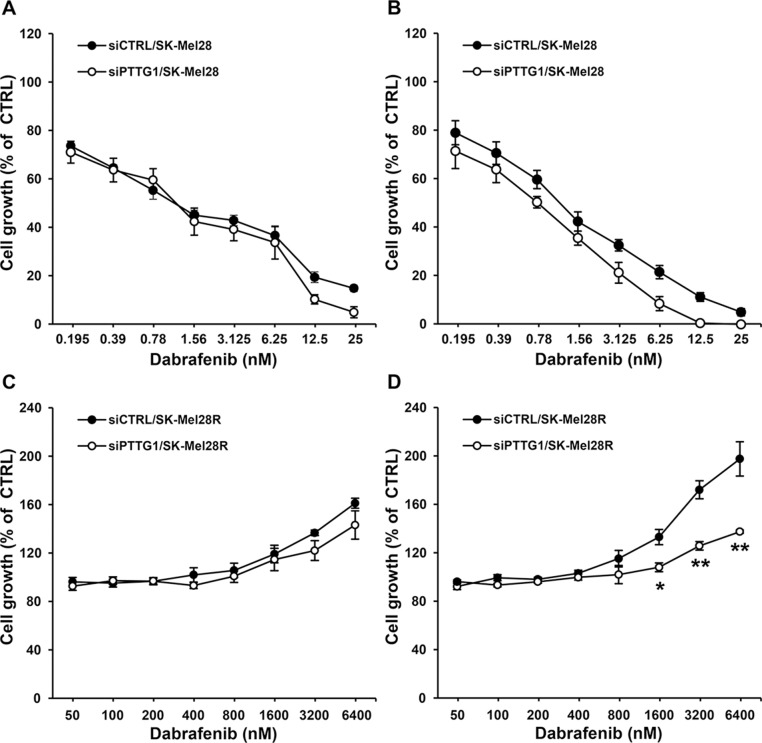
Figure 3. Effect of PTTG1 silencing on SK-Mel28 and SK-Mel28R cell sensitivity to dabrafenib.
SK-Mel28 (A, B) and SK-Mel28R (C, D) cells were transiently transfected with siPTTG1 or siCTRL and 24 h later incubated with dabrafenib or with DMSO alone for three (A, C) or five (B, D) days. Proliferation was then assessed by the MTT assay. Data are expressed in terms of percentage of growth of cells treated with dabrafenib with respect to cells treated with DMSO alone (CTRL). Each value represents the arithmetic mean of four independent experiments. Bars, SEM. For each experiment, the dabrafenib IC50 value was calculated as described in the “Materials and methods” section. The IC50 mean value ± SEM after three days of treatment with dabrafenib was 1.38 ± 0.23 nM for siCTRL/SK-Mel28 cells and 1.08 ± 0.15 nM for siPTTG1/SK-Mel28 cells. The IC50 mean value ± SEM after five days of treatment with dabrafenib was 1.12 ± 0.15 nM for siCTRL/SK-Mel28 cells and 0.68 ± 0.05 nM for siPTTG1/SK-Mel28 cells (P < 0.05). IC50 values were not assessable for the SK-Mel28R cell line. **P < 0.01 and *P < 0.05 comparing siPTTG1/SK-Mel28R cells with siCTRL/SK-Mel28R cells at the indicated concentrations of dabrafenib.

