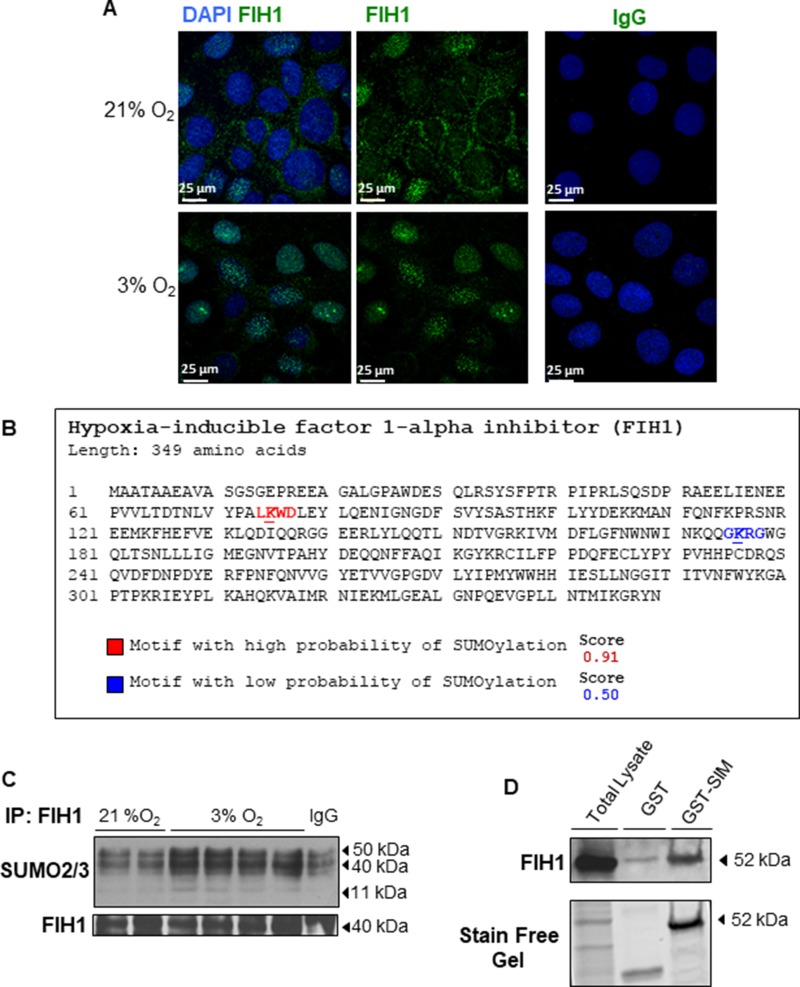
Figure 2. Localization and post-translational modification of FIH1 in hypoxia.
(A) Spatial localization of FIH1 (green) in JEG-3 cells incubated in 3% O2 or standard conditions. Nuclei were counterstained with DAPI (blue). White bars represent 25 µm. (B) In silico analysis of FIH1 protein sequence indicating potential SUMOylation sites with the high probability motif (red) and the low probability motif (blue). Analysis was performed using SUMOplot™ analysis program. (C) Representative Western Blots showing SUMO conjugation of FIH1 by SUMO2/3 in JEG3-cells exposed to hypoxic or standard conditions. (D) Western Blot for FIH1 before and after enrichment of polySUMOylated protein in whole JEG-3 cells lysate. Total: Total Cell Lysate; GST: Control affinity purification; GST-SIM: Affinity Purification of PolySUMOylated Protein. Protein loading was assessed using stain free activation of the gel.

