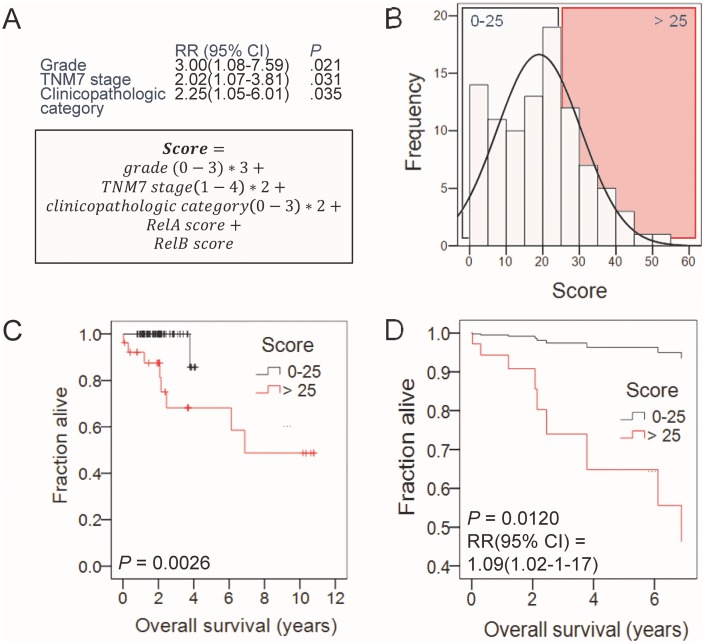
Figure 6. Cox regression analysis of the impact of clinical variables, risk factors, and NF-κB subunit expression on survival.
(A) Risk ratios (RR) with 95% confidence intervals (CI) and probability values (P) of the of the independent impact of the listed variables on survival. Note that successive variable only emerged as important after elimination of the preceeding variables. Equation showing the proposed laryngeal cancer prognostic score. (B) Frequency distribution of study cohort according to the newly devised score showing the two groupings with low (0-25; n = 70) and high (> 25; n = 26) scores. (C) Kaplan-Meier survival estimates of laryngeal cancer patients with low (0-25) and high (> 25) scores. P, probability by log-rank test. (D) Cox regression survival estimates of laryngeal cancer patients with low (0-25) and high (> 25) scores. P, probability by proportional hazards model. RR, Risk ratio of high versus low score. CI, 95% confidence interval.

