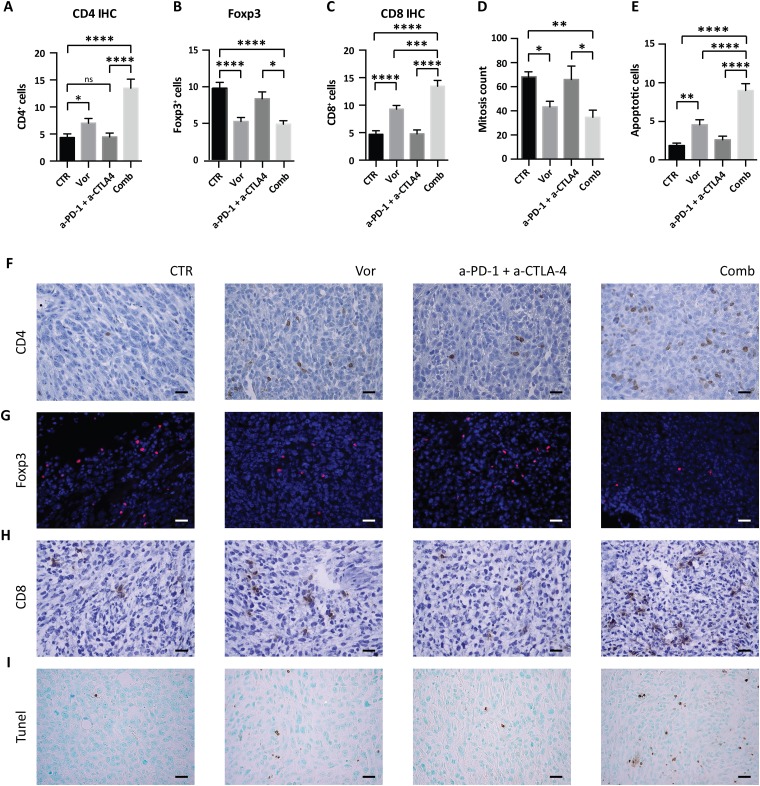
Figure 6. Effect of vorinostat/immunotherapy treatment on immune cell subset, proliferation and apoptosis in 4T1 allograft tumors.
Paraffin-embedded tissues were generated from each tumor for IHC and immunofluorescence analysis. Slices were stained for CD4 (A), Foxp3 (B) and CD8 (C) by IHC or immunofluorescence. Mitotic counts (D) were performed on H&E-stained sections, while apoptosis was measured by TUNEL assay (E). Data are presented as the mean ± SEM. Statistical significance is indicated by p-values as * P ≤ 0.05; ** P ≤ 0.01; *** P ≤ 0.001; **** P ≤ 0.0001; Ns: non significant. Representative image for CD4 (F), Foxp3 (G), CD8 (H), and TUNEL assay (I) are shown. Images were captured with a 40x objective on a light microscope. Scale bars correspond to 20μm. Scale bars correspond to 20μm.

