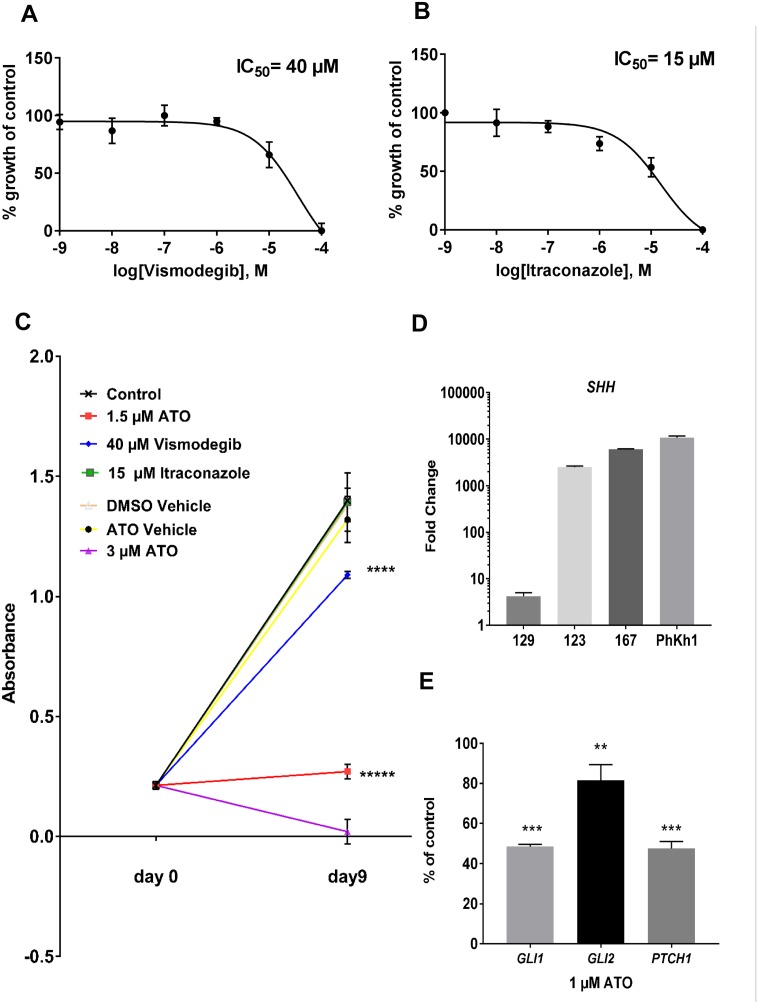
Figure 1. PhKh1 cells are more sensitive to GLI than to SMO inhibition.
(A-B) PhKh1 cells were treated with vismodegib or itraconazole at doses from 1 nM to 100 μM. The logarithm of the molarity is displayed on the X-axis. The percent of viable cells compared to the control treated with vehicle alone is shown on the Y-axis. The data were fitted to a sigmoidal dose-response curve using GraphPad software. A representative experiment of three independent experiments is shown. (C) The PhKh1 cells were grown for nine days in the presence of ATO, itraconazole, vismodegib or vehicle alone at the indicated concentrations. The absorbance after incubation with the WST-1 reagent is indicated. Statistics were performed using student’s t-test at day 9 compared to the control: ****p<0.0001, *****p<0.00001. (D) The expression of the SHH ligand was analyzed by qRT-PCR in normal brain, the primary HGNET-BCOR tumor (no 123), a metastasis of HGNET-BCOR (no 167), a medulloblastoma of the WNT subtype (no 129) and the PhKh1 cells. The fold change of the expression with respect to normal brain is shown. (E) PhKh1 cells were incubated for 18 hours with 1 μM ATO or vehicle alone. After RNA extraction, qRT-PCR analysis of GLI1 GLI2 and PTCH1 was performed. The expression in the ATO-treated cells is shown as percent of the expression in the vehicle-treated cells. Expression analysis was done in triplicates. Statistics were performed using student’s t-test: *** p=0.001, ** p=0.0056.

