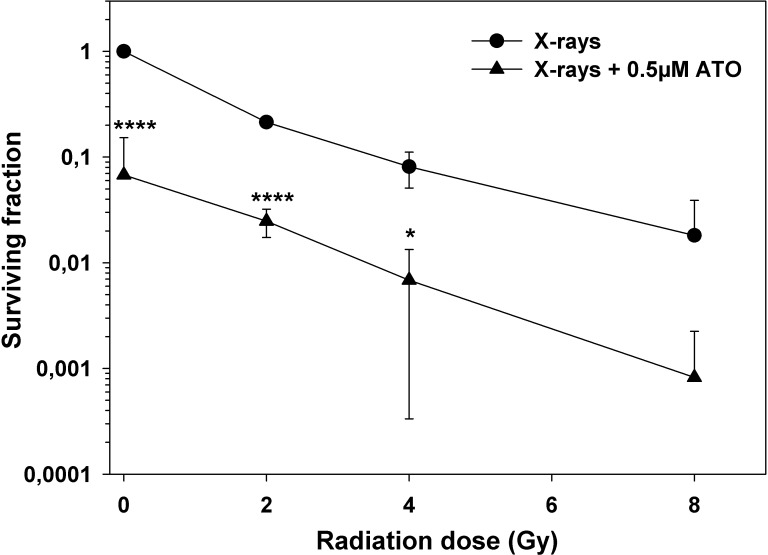
Figure 2. Additive cytotoxicity of radiation and ATO in PhKh1 cells.
Dose-response survival curves of PhKh1 cells after exposure to X-rays with or without ATO. Data are shown as the mean ± standard deviation from three independent experiments. Lines are drawn to guide the eye. All data were normalized to non-irradiated cells without ATO. Statistics were performed using student’s t-test: *p<0.05, ****p<0.0001.

