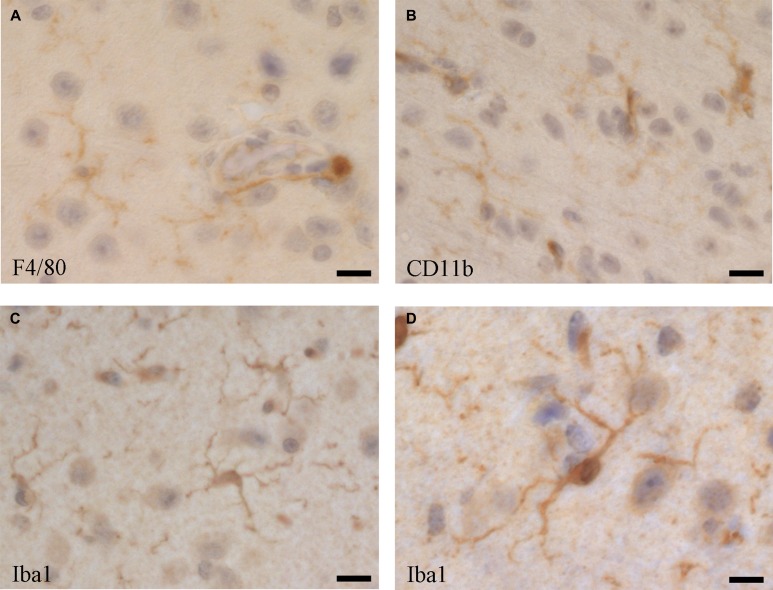
Figure 2. Microglia cells visualised by immune histochemistry in the mouse brain using antibodies directed against.
(A) F4/80 (Serotec, Kidlington, UK, clone Cl:A3-1), (B) CD11b (BD Pharmingen, San Diego, USA, cat. no. 553308), and (C and D) Iba1 (Abcam, UK, cat. no. ab5076). Bars: (A and C) 25 µm, (B) 20 µm, (D) 40 µm.

