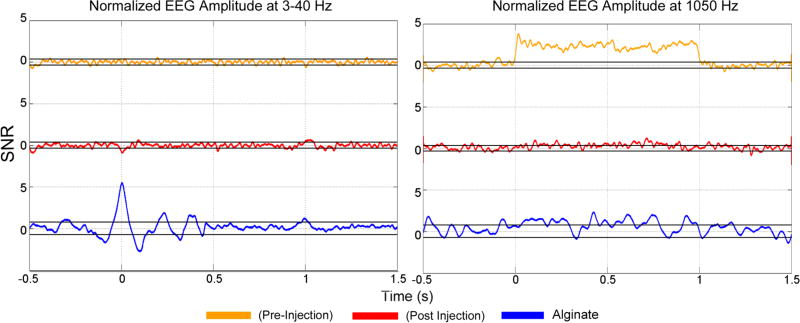
Figure 3. Normalized EEG amplitude responses.
Grand average evoked potentials (EP) in the 3–40 Hz band (left) and 1050 Hz amplitude response (right) over the course of the two second long pFU off/on trial. The time course shown is from 0.5 s prior to pFU stimulation to 1.5 s after pFU stimulation, to allow us to illustrate pFU-stimulation onset and offset effects. Shown are data from alginate (blue), before injection of Beuthanasia (‘pre-injection’, in green) and after injection of Beuthanasia (‘post injection’, in red), in units of SNR relative to the ‘pFU-off’ period. Black lines for each graph indicate the 99.5% confidence intervals. Note that the EP are shown as an SNR of measured voltage averaged over 3–40 Hz, while the 1050 Hz response is shown as the SNR of the amplitude of the band pass filtered voltage between 1040 and 1060 Hz.

