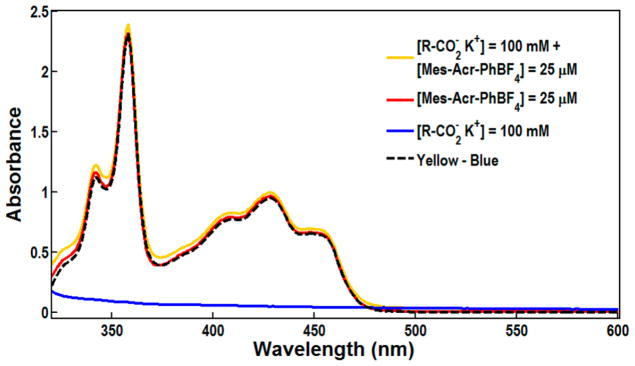
Figure 8.
UV/vis absorption spectra of the catalyst before and after adding carboxylate salt. The red line shows Mes-Acr-Ph before the addition of carboxylate. The yellow line shows the absorption spectrum of the catalyst after adding the carboxylate. The blue line is the absorption spectrum of the carboxylate and the dashed black line is the subtraction of the carboxylate from the absorption spectrum of the catalyst with added quencher (yellow-blue).

