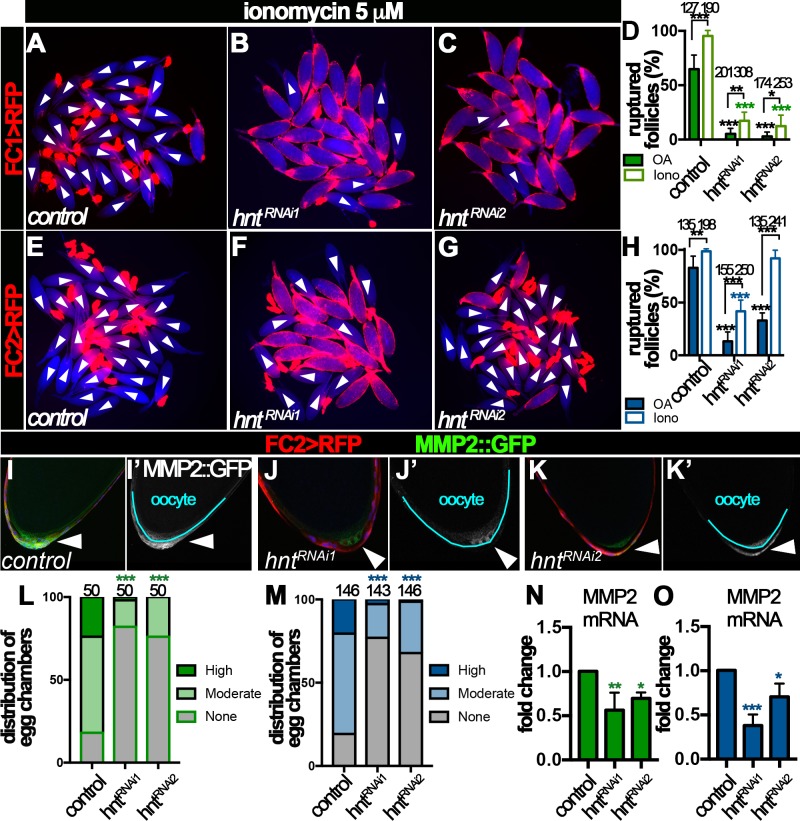
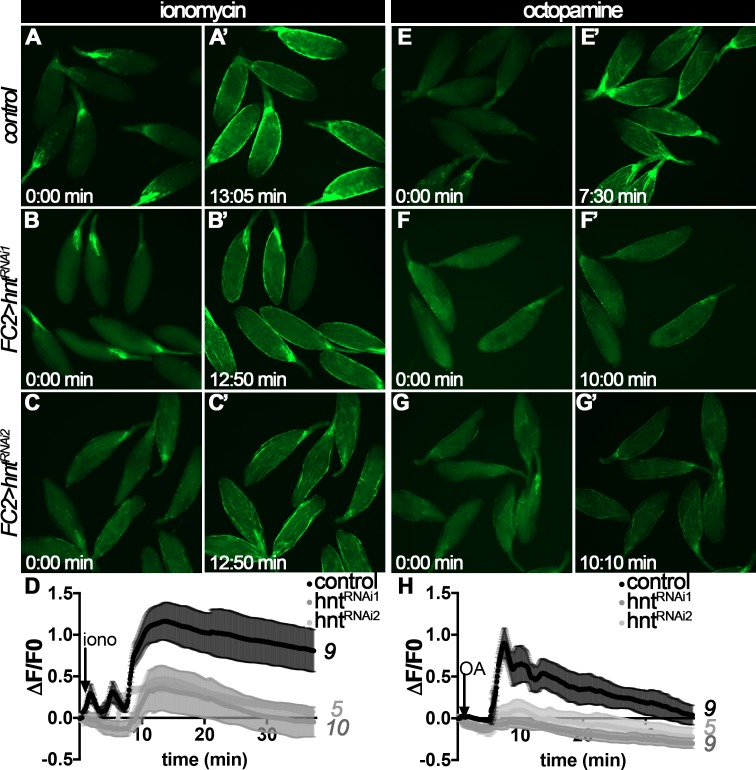
Figure 6. Hindsight regulates Mmp2 expression in stage-14 follicle cells.
(A–H) Response of egg chambers isolated according to FC1 (A–D) or FC2 (E–H) to ionomycin-induced rupture in three hours. (A–C and E–G) Representative images show control (A and E) and hntRNAi (B–C and F–G) egg chambers after the culture. Bright field images of the egg chambers are shown in blue, and white arrowheads mark ruptured egg chambers. Quantification of rupture response to OA or to ionomycin is shown in (D and H). (I–K) Representative images show Mmp2::GFP expression (green in I-K and white in I’-K’) in control (I–I’) or hntRNAi (J–K’) egg chambers with FC2 Gal4 (Red). Nuclei are labeled with DAPI and shown in blue (I–K). Arrowheads point to posterior follicle cells, and oocytes are outlined in cyan (I’–K’). (L–M) Quantification of Mmp2::GFP expression in control and hntRNAi egg chambers using FC1 (L) or FC2 (M) Gal4. (N–O) Quantification of Mmp2 mRNA levels in hntRNAi egg chambers with FC1 (N) or FC2 (O) Gal4. *p<0.05, **p<0.01, ***p<0.001.


