. 2017 Dec 22;6:e31101. doi: 10.7554/eLife.31101

Figure 1. Morphology and endocytic activity of neurons grown on substrates of varying stiffness.

(A) Substrate modulus-dependent biphasic distribution of lamellipodium occupancy. (A1) Representative intensity profile of phalloidin-stained hippocampal neurons on a soft hydrogel (E = 0.1 kPa). Lamellipodium occupancy (LO) of each phalloidin-positive segment is calculated by the formula shown in the box at bottom right. (A2) Representative images of neurons grown on substrates for 5 hr or 16 hr and stained with phalloidin (Red), DAPI (Blue), and antibodies against Tuj-1 (Green), as indicated. Scale bar: 20 μm. (A3) Histograms of LO distributions at 5 hr showing two distinct patterns in 0.1, 1, or 20 kPa cultures (n > 68 cells for each experiment). Simplified drawings above histograms illustrate the typical segmented lamellipodium (‘SL’) and broad lamellipodium (‘BL’) phenotypes in 5 hr neuronal cultures, as indicated. (A4 and A5) Histograms summarizing the percentages of lamellipodium phenotypes seen in 5 hr cultures (A4) and the distributions of neurite numbers (A5) in 16 hr cultures. Data represent mean ±SEM (n > 3 independent experiments; 150 cells for each culture; *p<0.05; **p<0.01; ****p<0.0001; one way ANOVA with Dunnett’s post hoc test). (B) Enhanced membrane endocytosis in 0.1 kPa cultures. Time-lapse images (20 frames; 2 min intervals) of neurons isolated from E17.5 rat cortices transfected in utero at E16 without (B1) or with (B2) IRES constructs harboring control EGFP and/or a dominant-negative dynamin II mutant (DynIIK44A), cultured on 0.1 kPa or 20 kPa gels for 5 hr, followed by endocytosis assay in the presence or absence of the endocytosis inhibitors Dynole 2–24 or Dyngo 4a, as indicated. Dashed lines surround the region of interest (ROI) in quantitative FM4-64 measurements. Asterisks in B2 mark non-transduced neighboring cells. Graph at right summarizes the accumulation curves of FM4-64 signal (±SEM, n > 3 independent experiments, 10–20 cells per group, normalized to t = 0 value; ****p<0.0001; two-way RM ANOVA with Dunnett’s post hoc test), which reflects the rate of FM4-64 uptake at different time-points after FM4-64 loading. The data were fitted to a single exponential to determine the time (t1/2) required to reach half of the plateau value. (B3) Representative images of neurons plated on 0.1 kPa or 20 kPa gels overnight, followed by incubation of quantum dot-conjugated brain-derived neurotrophic factor (QD-BDNF) for 5 hr. Dot plot showing that 0.1 kPa cultures exhibited a significantly higher level (n = 39–46 cells from three independent experiments; **p<0.001; ****p<0.0001; one-way ANOVA with Dunnett’s post hoc test) of QD-BDNF internalization (as reflected by a ~2-fold greater quantity of intracellular QD-BDNF) than 20 kPa cultures. (C) Expression of DynIIK44A prevents neurite formation and cortical neuron migration in vivo. (C1) Fluorescence images of P0 rat cortices transfected in utero at E16 with IRES constructs harboring control EGFP and/or DynIIK44A. The middle panels show 16x magnifications of boxed regions of the corresponding P0 cortex in the top panels. The bottom panels show sample tracings of 2D projections from confocal images of typical cortical neurons in the corresponding P0 cortex. Bar, 100 μm. (C2 and C3) Histograms showing the localization (C2) and the percentage (C3) of transfected cortical neurons exhibiting unipolar/bipolar polarized processes (‘polarized’), multiple short neurites without a long tailing process (‘unpolarized’), or no process (‘no neurite’; arrowheads in the middle panels) in the cortical plate (‘CP’) or subventricular zone/intermediate zone (‘SVZ/IZ’) regions. Datasets (mean ±SEM, n > 150 cells per cortex, >5 cortices each; ***p<0.001, multiple t test) showing significant differences are marked.

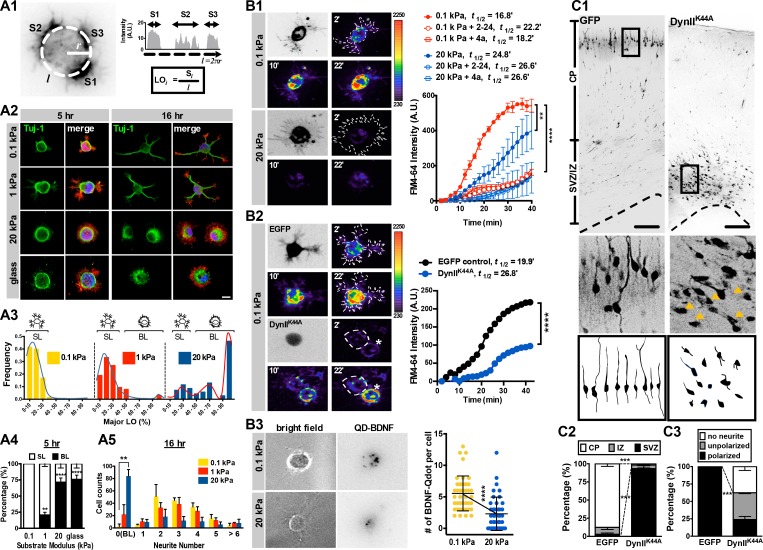
Figure 1.

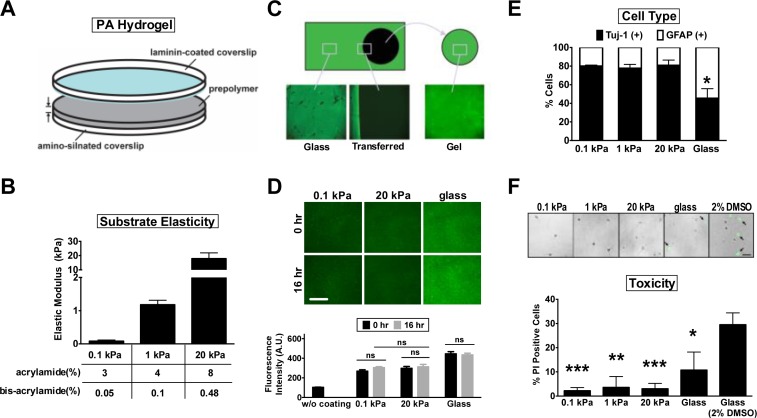
Figure 1—figure supplement 1. Hippocampal neurons cultured on polyacrylamide hydrogels of varying stiffness.

Figure 1—figure supplement 1.

(A) Schematic of the three-layer assembly of polyacrylamide (PA) hydrogels (diameter = 1.8 mm, thickness = 200 μm). Light blue, the poly-L-Lysine/laminin-coated side of the coverslip. (B) Atomic force microscopy measurement of elastic modulus (±SEM, n = 3) of PA gels. Table shows the ratio of acrylamide and bis-acrylamide used to determine the crosslink density and the stiffness (0.1 kPa, 1 kPa, and 20 kPa) of the polymers. (C, D) Transfer printing of laminin on hydrogels. (C) Representative images of PA hydrogel peeled from laminin-coated coverslips, both immunostained with antibodies against laminin (shown in green). Note that laminin was completely transferred from the laminin-coated coverslip to the gel surface. (D) Quantification of laminin fluorescence intensity (±SEM, n > 3; ‘ns’, no significance; t-test) on the gel surface before and after incubation for 16 hr with culture medium. Acid-washed coverslips were pre-coated with laminin (a stock concentration of 1.62 mg/ml) in a 1:50 dilution. Note that the staining intensity of surface laminin was comparable between 0.1 kPa and 20 kPa gels. (E) Cell type enrichment analysis for hippocampal cultures. Cultured neurons plated on substrates were immunostained with antibodies against the neuron-specific marker Tuj-1 and the astroglial marker glial fibrillary acidic protein (GFAP). Histogram showing percentages (±SEM; n > 200 cells for each group from more than three independent experiments; *p<0.05; relative to that of 0.1 kPa culture, t-test) of Tuj-1- or GFAP-positive cells in hippocampal cultures at 3 days in vitro (DIV). (F) Cell viability analysis for hippocampal neurons cultured on PA gels and glass. DIV3 cultures were subjected to propidium iodide (PI) staining. Arrow, apoptotic cells with fragmented nuclei (PI positive). Dimethyl sulfoxide (2%) was used as a positive control of maximum cytotoxicity. Data represent mean ±SEM (n > 200 cells for each group from more than three independent experiments; *p<0.05; ***p<0.001; relative to that of glass culture, t-test).
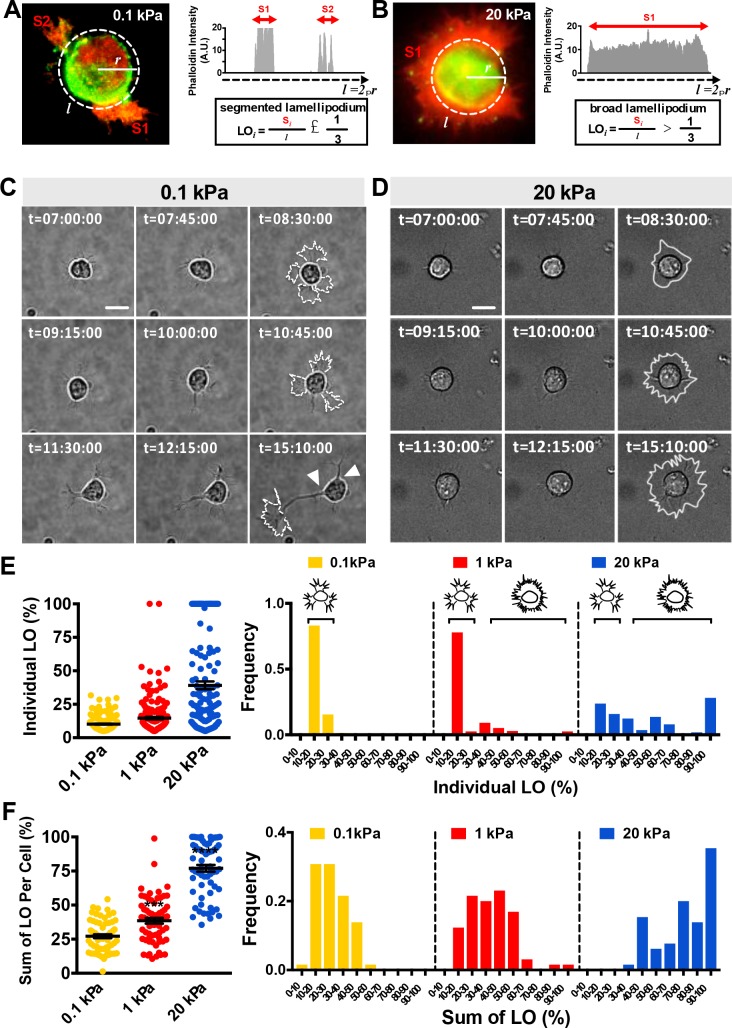
Figure 1—figure supplement 2. Differential lamellipodium phenotypes of neurons grown on hydrogels.

Figure 1—figure supplement 2.

(A, B) Phalloidin intensity profiling of neurons on soft (E = 0.1 kPa; A) and stiff (E = 20 kPa; B) hydrogels stained with phalloidin (Red) for F-actin filaments and antibodies against Tuj-1 (Green), as indicated. Lamellipodium occupancy (LO) of phalloidin-positive segments (‘S’) along the cell periphery was calculated according to the formula shown in the lower panel. Cells exhibiting typical morphologies of the segmented lamellipodium (‘SL’, A) or broad lamellipodium (‘BL’, B) are shown. (C, D) Time-lapse bright-field images of newly plated neurons on 0.1 kPa (C) or 20 kPa (D) gels. Note that neurite initiation sites (arrowheads at time-point = 15:10:00) are correlated with the positions of initial segmented lamellipodia (delimited by the dashed line in panel C; individual LO < 0.33). Broad lamellipodia of a neuron grown on a 20 kPa gel are delimited by solid lines in panel D. Scale bar = 20 μm. (E, F) Distribution of individual lamellipodium occupancy (E) and total lamellipodium occupancy (F) from the same sets of experiments shown in main Figure 1A3. Simplified drawings above histograms illustrate the typical segmented lamellipodium and broad lamellipodium phenotypes of hippocampal neurons grown on soft (E = 0.1 kPa or 1 kPa) and stiff (E = 20 kPa) PA hydrogels.
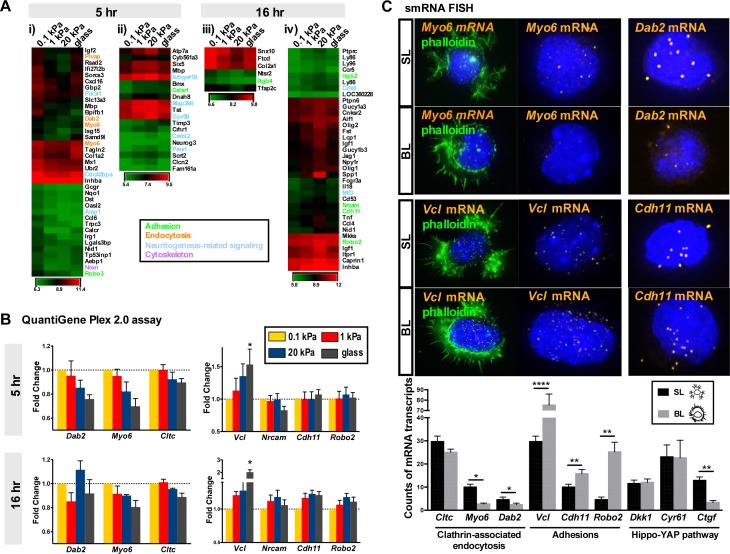
Figure 1—figure supplement 3. Differential gene expression pattern of neurons grown on hydrogels.

Figure 1—figure supplement 3.

(A) Up-regulation of clathrin-associated endocytosis genes in 0.1 kPa cultures. Gene expression patterns emerging from microarray analysis were grouped into four modules: expression increased with substrate softness in 5 hr (i) or 16 hr (iii) cultures, or increased with substrate stiffness in 5 hr (ii) or 16 hr (iv) cultures (cut off: >1.5-fold change, p<0.05, n = 3 independent experiments). Normalized expression levels are represented by a color-coded heatmap. (B) A QuantiGene Plex branched-chain DNA amplification assay validated the relatively increased levels of mRNAs encoding the clathrin-associated endocytosis factors Dab2, Myo6, and Cltc in neurons grown on 0.1 kPa gels. Data represent fold changes in RNA levels (±SEM; n = 4–5 independent experiments; relative to that of 0.1 kPa culture; *p<0.05; t test). (C) Representative single-molecule RNA fluorescence in situ hybridization (smRNA FISH) images of mRNA encoding Myo6, Dab2, Chd11, Vcl, or Cry61 on segmented lamellipodium (SL) or broad lamellipodium (BL) neurons in 5 hr cultures, as indicated. Histograms showing average number (±SEM; n = 42–52 cells; *p<0.05; **p<0.01; ****p<0.0001; t test) of smRNA FISH puncta for each gene per single neurons of the SL and BL cells.