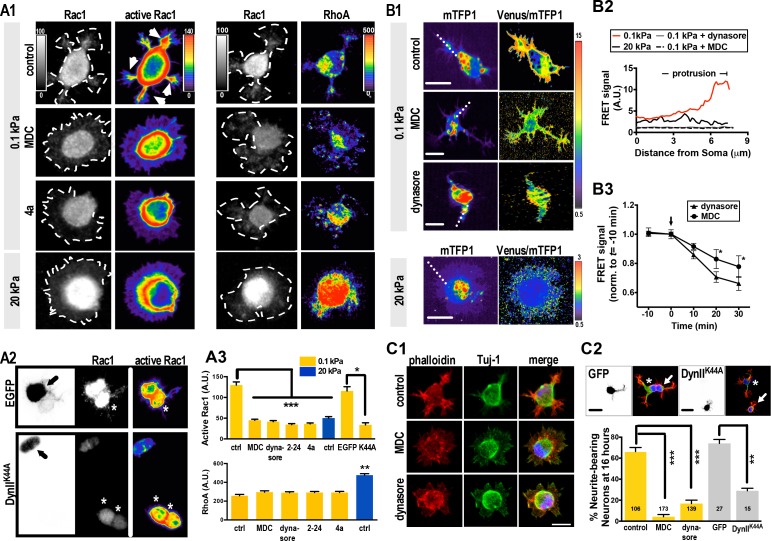
Figure 2. Substrate modulus-dependent Rac1 increase and lamellipodium segmentation require endocytic activity.
(A) Inhibition of endocytosis suppresses Rac1 activity in 0.1 kPa cultures. (A1–A3) Representative images of 5 hr neuronal cultures treated with the endocytosis inhibitors dynasore (50 μM, 1 hr), Dynole 2–24 (2–24, 2 μM, 1 hr), Dyngo 4a (4a, 2 μM, 1 hr) or monodansylcadaverine (MDC, 100 μM, 1 hr) and immunostained with antibodies against Rac1, GTP-bound Rac1 (‘active Rac1’; A1, left panel), or RhoA (A1, right panel). The same staining procedure was applied to the IUE neuron (A2, arrow) expressing control EGFP and/or DynIIK44A as shown in A2. Asterisks mark non-transduced neighboring cells. Intensities of active Rac1 and RhoA correspond to linear pseudocolor maps. (A3) Histograms, all from experiments similar to those described above, showing that endocytosis inhibition significantly decreases levels of total Rac1 and active Rac1 (but not RhoA) at lamellipodial protrusions (at 5 hr) in 0.1 kPa cultures. Data represent mean intensity ±SEM (n > 50 per group from three independent experiments; ***p<0.001; one-way ANOVA with Dunnett’s post hoc test). (B) Representative FRET-based imaging of hippocampal neurons transfected with a FRET indicator for GTP-bound Rac1 (Rac1-2G; see Materials and methods). (B1) Images of monomeric Teal fluorescent protein 1 (mTFP1) and FRET signals (presented as pseudocolor maps in a linear scale) acquired from neurons plated on 0.1 kPa gels in the presence or absence of dynasore (50 μM) or MDC (100 μM) for 1 hr. Bar, 20 μm. (B2) Traces depict active Rac1 levels at protrusions, measured across the dashed line as shown in B1, and indicated by FRET signal calculated as the ratio of Venus to mTFP1 fluorescence [F(Venus)/F(mTFP1)]. (B3) Quantitative measurement of FRET signals (±SEM, n = 5 cells for each group; *p<0.05, compared to time = 0 value; multiple t tests) before and after bath application of 50 μM dynasore or 100 μM MDC. Arrow marks drug addition (time = 0). (C) Inhibition of endocytosis decreases the probability of lamellipodium segmentation and delays neurite initiation on soft gels. (C1) Representative fluorescent images of neurons plated on 0.1 kPa gels for 5 hr in the absence or presence of indicated endocytosis inhibitors. Scale bar: 20 μm. (C2) Representative fluorescent images of transfected IUE neurons (arrow) expressing control EGFP and/or a dominant-negative dynamin II mutant (DynIIK44A), cultured on 0.1 kPa gels for 16 hr, and stained with phalloidin (Red), DAPI (Blue), and antibodies against Tuj-1 (Green). Asterisks mark non-transduced neighboring cells. Scale bar: 20 μm. Histograms summarize the percentages (±SEM; ***p<0.001, one way ANOVA with Dunnett’s post hoc test) of 16 hr neurons bearing neurites in the presence or absence of dynasore (50 μM, 5 hr treatment) or MDC (100 μM, 5 hr treatment), as indicated.


