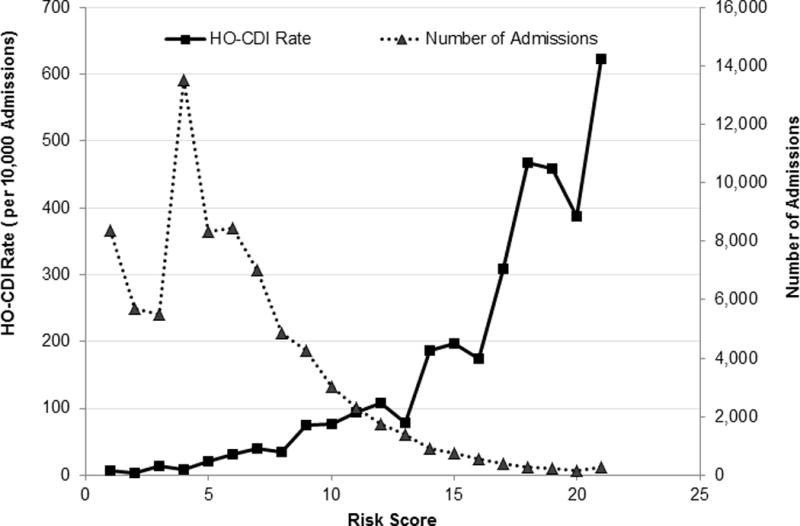
Figure 3.

Distribution of HO-CDI Risk Score and Corresponding Admission Volume. *Score 20 and above were collapsed because of small numbers. **Model with CO-CDI Pressure was presented. Model with All-CO-CDI Pressure yielded similar distribution. Data were not shown.
