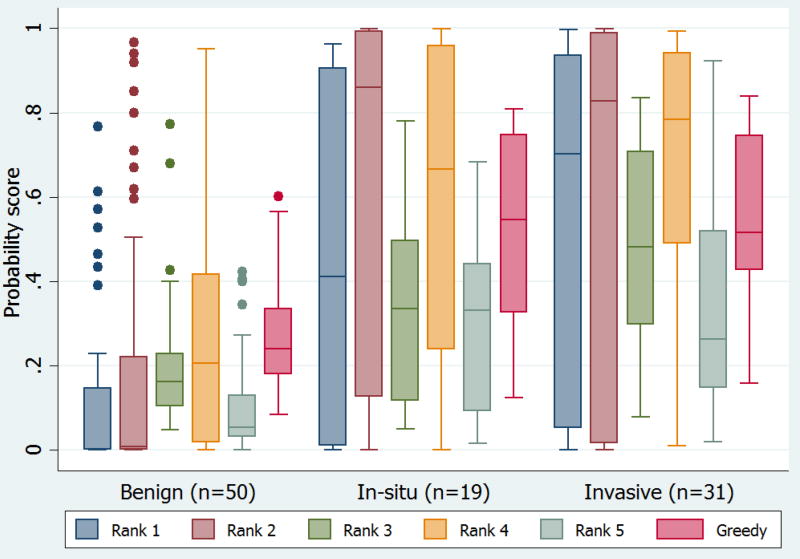
Figure 1. Algorithm probability scores.
Mean probability score for top five algorithms and best fusion algorithm (Greedy) by lesion diagnosis (i.e., benign nevi or lentigines, melanoma in situ, and invasive melanoma). Probability scores from computer algorithms were in the range 0 to 1, with scores closer to 0 indicating a greater probability of a benign diagnosis and scores closer to 1 indicating a greater probability of a malignant diagnosis. The upper and lower bounds of the boxed area represent the 25th and 75th percentiles, the line transecting the box is the median value, and whiskers indicate the 5% and 95% percentiles. Dots that fall outside of the whiskers indicate extreme, or outlier values.

