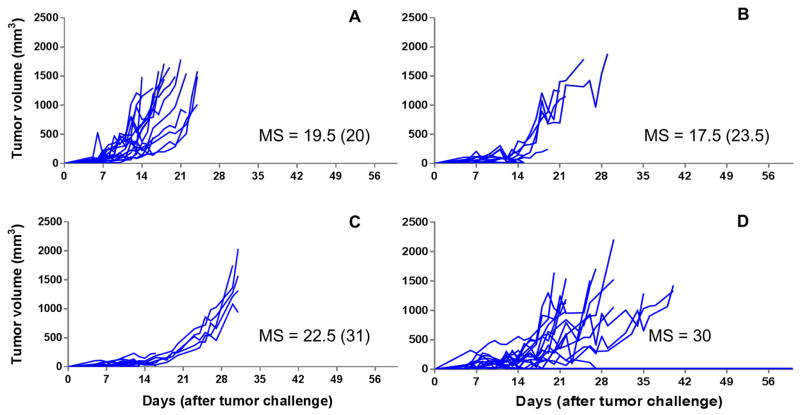
Figure 6. Spider plots for tumor volumes of CT-26-challenged BALB/CJ mice receiving different 5-FU formulations.
Mice received indicated treatments (on Day 5 post tumor challenge, when palpable tumor was present). A: naive mice without treatment (n = 16); B: 5-FU solution IP (120 mg/kg) (n = 10); C: 5-FU solution SC (120 mg/kg) (n = 10); D: 5-FU-loaded PLGA pellets (50% w/w 5-FU, 120 mg/kg) (n = 10). Median survival times (MS, days) using all-cause mortality are shown besides the spider plots of each group. The median survival times when events were death from no efficacy are equal to those when all-cause mortality was used, unless otherwise indicated in parentheses.

