Fig. 2.

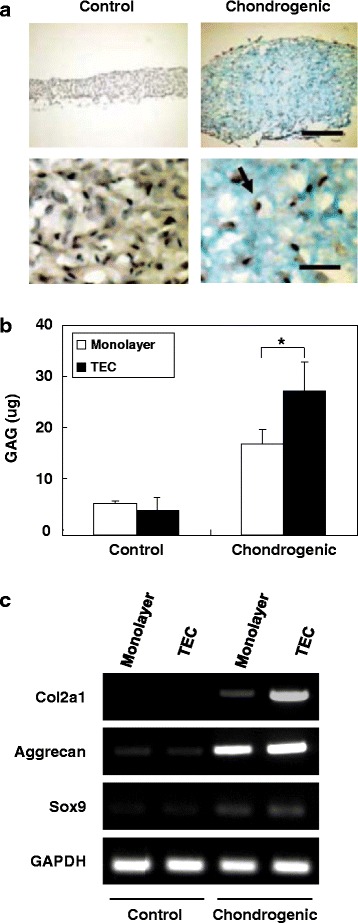
Chondrogenic differentiation capacity of TECs. a Alcian blue staining of a TEC in control medium or in chondrogenic differentiation medium. Bar = 300 um (upper). Bar = 50 um (lower). Arrow showing the cell nuclei are in lacuna. b The quantification of GAG content of synovial MSC monolayer culture or TEC in the control medium or in the chondrogenic medium. GAG synthesis is significantly higher in the TEC exposed to the chondrogenic medium (N = 8). *; p < 0.05. c Semiquantitative reverse transcription–polymerase chain reaction (RT-PCR) analysis of synovial MSC monolayer culture or TEC for chondrogenic marker genes, type II collagen (Col2a1), aggrecan, SOX9, and GAPDH. Quoted and modified from Ando et al., Tissue Eng Part A 2008
