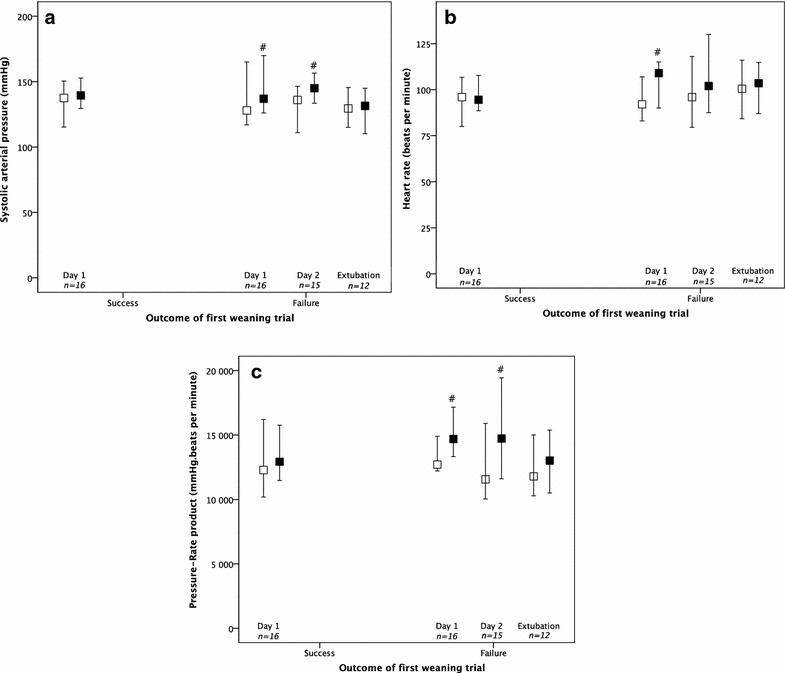
Fig. 2.

Systolic arterial pressure (a), heart rate (b) and pressure-rate product (c) at the start (white square) and the end (black square) of consecutive weaning trials during the weaning process (n = 31), according to first trial outcome (success or failure). #p value < 0.05 as compared to the start of weaning trial (Wilcoxon test)
