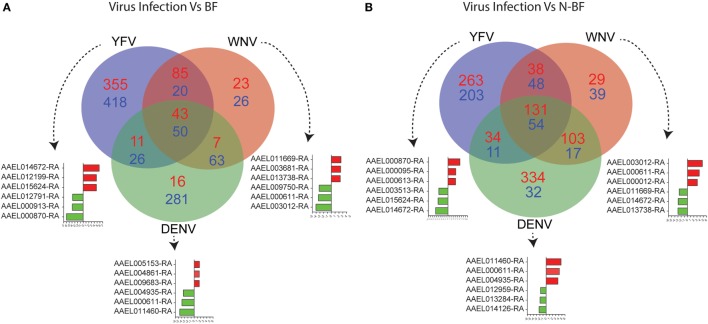
Figure 2.
Critical signature differences in the distinct feeding schedules. (A) Differentially expressed genes (DEGs) from the comparison of genes from virus infected mosquitoes [yellow fever virus (YFV), dengue virus (DENV), and West Nile virus (WNV) vs. blood-fed (BF)]. (B) DEGs from the comparison of genes from virus infected mosquitoes (YFV, DENV, and WNV vs. non-BF). The blue numbers represent downregulated genes and the red numbers represent upregulated genes by absolute log2-transformed fold-change ≥1 criterium. Red and green bars correspond to up- and downregulated genes, respectively.

