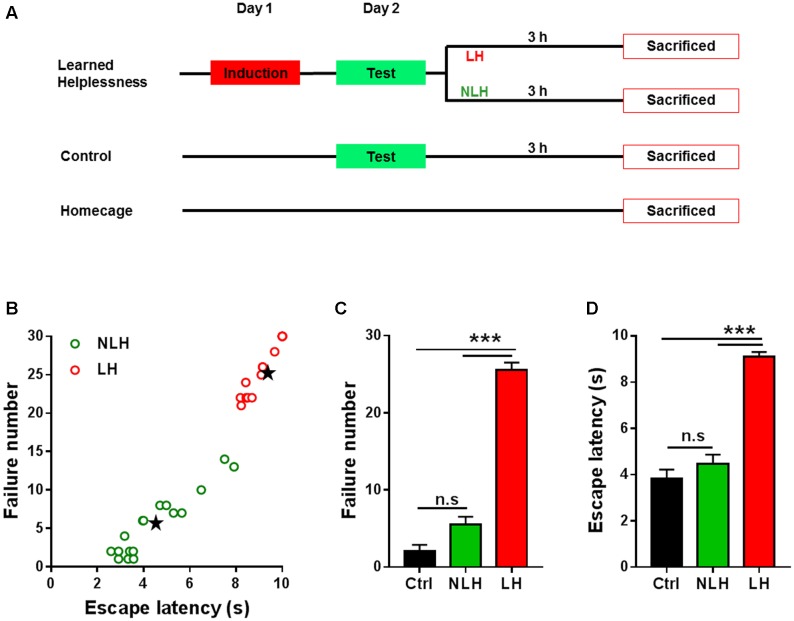
FIGURE 1.
Experimental design and behavioral readouts of learned helplessness experiments. (A) Schematic illustration of the experimental design of learned helplessness showing three main groups of animals: learned helplessness, control and homecage. After test session on day 2 learned helplessness mice were divided into learned helpless (LH) and non-learned helpless (NLH) groups. All mice were sacrificed at the same time point; namely 3 h after test session. (B) Clustering analysis of mice subjected to learned helplessness procedure, using the numbers of escape failure and latency to escape (in seconds, s) as clustering parameters. Mice were classified as LH (red circles) or NLH (green circles) by clustering analysis and linear discriminant analysis (see Equations 1 and 2, Materials and Methods). Black stars represent the centroids for LH and NLH groups. (C,D) The numbers of escape failure (C) and latency to escape (D) during the test session on day 2 of the three groups of mice LH (n = 14), NLH (n = 17) and control (Ctrl, n = 10). Data are presented as mean ± SEM. One Way ANOVA was followed by Bonferroni’s post hoc test. n.s, non-significant; ∗∗∗p < 0.001.

