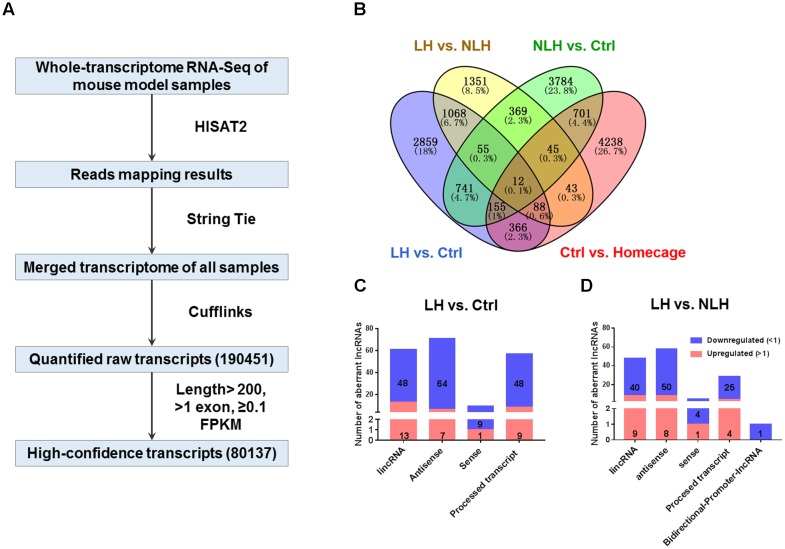
FIGURE 2.
RNA-seq flow chart, profiling and classification analyses (A) The flow chart of RNA-seq procedure including Hierarchical Indexing for Spliced Alignment of Transcripts-2 (HISAT2), String Tie, Cufflinks and expression levels for the merged transcripts in Fragments Per Kilobase of transcript per Million mapped reads units (FPKM, see Materials and Methods) obtained from mouse hippocampal tissue (4 groups of mice, n = 4 mice per group). (B) Venn diagram showing overlap analysis to identify differentially expressed transcripts using multiple comparisons: learned helpless vs. control (LH vs. Ctrl, blue), learned helpless vs. non-learned helpless (LH vs. NLH, yellow), Ctrl vs. Homecage (red) and Ctrl vs. NLH (green). (C,D) The number and categories of differentially expressed lncRNAs identified in LH vs. Ctrl (C) and LH vs. NLH (D) comparisons. Blue bars represent downregulated lncRNAs, while red bars represent upregulated lncRNAs.

