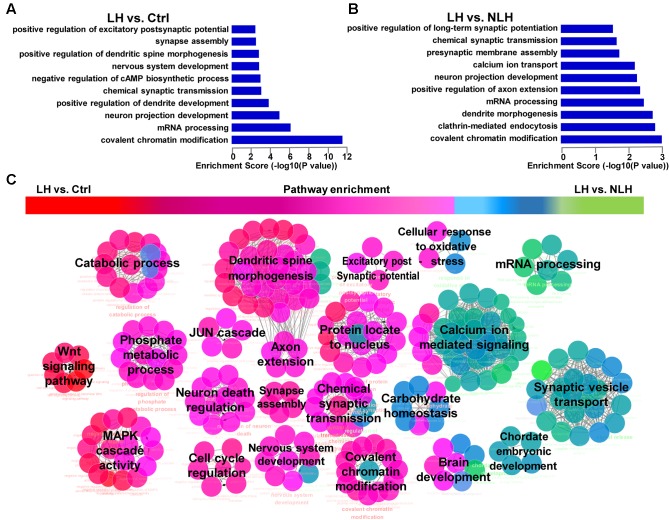
FIGURE 4.
Gene Ontology and pathway enrichment analyses of mRNA. (A,B) The significant biological processes representing the functions of the differentially expressed mRNAs obtained from LH vs. Ctrl (A) and LH vs. NLH (B) comparisons. (C) Pathway enrichment analysis between LH vs. Ctrl and LH vs. NLH comparisons showing the signaling pathways that are commonly regulated in both comparisons. Red represents pathways enriched in LH vs. Ctrl comparison. Green represents pathways enriched in LH vs. NLH comparison. Pink (middle) represent signaling pathways that are commonly regulated and enriched in both comparisons.

