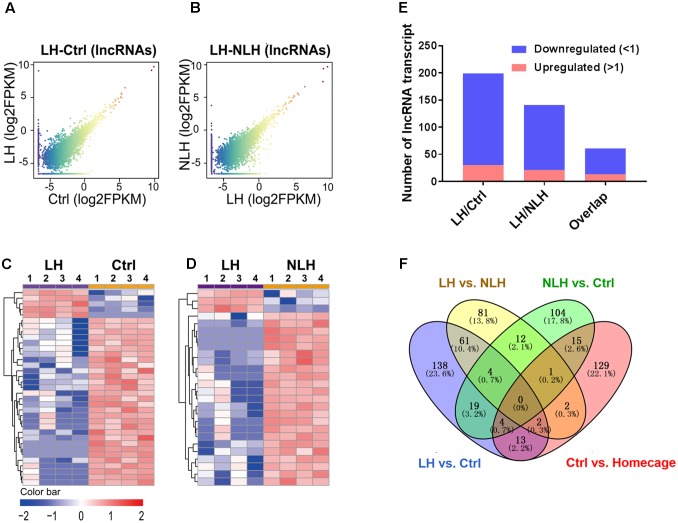
FIGURE 5.
Expression and profiling of lncRNA in LH vs. Ctrl and LH vs. NLH comparisons. (A,B) Scatter plotting of the global lncRNA expression pattern in the LH vs. Ctrl (A) and LH vs. NLH (B) comparisons. (C,D) Heatmap hierarchical clustering analysis of differentially expressed lncRNA transcripts from individual animals (n = 4 per group) in LH vs. Ctrl (C) and LH vs. NLH (D) comparisons. (E) The numbers of regulated lncRNA transcripts. Blue bars represent downregulated lncRNAs, while red bars represent upregulated lncRNAs. (F) Venn diagram showing overlap analysis of differentially expressed lncRNAs using multiple comparisons: learned helpless vs. control (LH vs. Ctrl, blue), learned helpless vs. non-learned helpless (LH vs. NLH, yellow), Ctrl vs. Homecage (red) and Ctrl vs. NLH (green).

