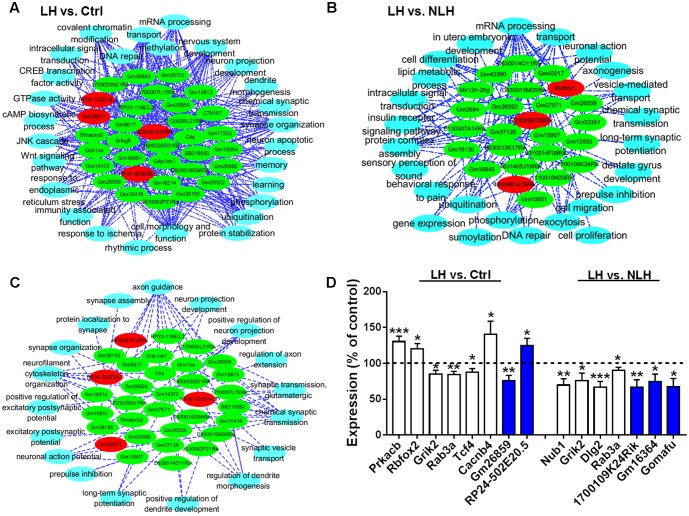
FIGURE 6.
lncRNA-function co-expression network analysis and real time PCR. (A,B) Functional co-expression networks analysis of biological processes and the differentially expressed lncRNAs in LH vs. Ctrl (A) and LH vs. NLH (B) comparisons. (C) Functional co-expression network showing the synapse-related regulatory lncRNAs identified in both comparisons (LH vs. Ctrl and LH vs. NLH). Red nodes indicate upregulated lncRNAs. Green nodes indicate downregulated lncRNAs. Blue nodes indicate bioprocesses. The dotted lines indicate significant correlation (positive or negative correlation). (D) Quantitative analysis of selected mRNAs (white bars) and lncRNAs (blue bars) that are differentially expressed in LH vs. Ctrl (left) and LH vs. NLH (right) comparisons (n = 10 mice per group). Dashed line represents the control level. Data were normalized to the house keeping gene GAPDH and expressed as a percentage of the average of the corresponding control for each gene. Two-tailed unpaired t-test; ∗p < 0.05, ∗∗p < 0.01, ∗∗∗p < 0.001. Data are presented as mean ± SEM.

