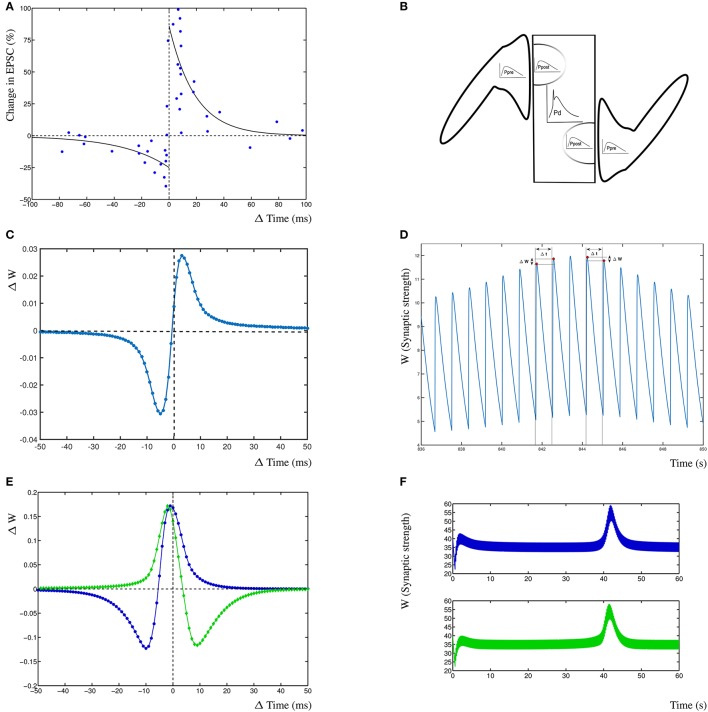
Figure 2.
Results from the dynHebb model. (A) STDP in hippocampal experiments demonstrating the standard STDP form (revisualized in blue, after Bi and Poo, 1998). The black lines are fitted exponential functions for comparison (redrawn after Bi, 2002). (B) Scheme of simulation model where two synapses project onto the same compartment, the presynaptic activity (Ppre) generates local postsynaptic activity (Ppost) which contributes to the dendritic activity (Pd). (C) STDP of 1 Hz stimulated single synapse model. The low change of weight is due to the low activation pattern. (D) Synaptic weight of the 1 Hz stimulated model over time, showing four distinct stimulation events, and the subsequent change in weights. (E) The dynHebb learning of competing synapses 1 (blue) and 2 (green). (F) Synaptic strength of both synapses over one entire simulation period, driven by 5 Hz periodic signal with 1 ms beat. Note that the synapses are stimulated every 200 and 201 ms respectively which results in the thickness of these curves.

